Ad Fontes Media
Ad Fontes Media is a Colorado-based media watchdog organization primarily known for its Media Bias Chart, which rates media sources in terms of political bias and reliability. The organization was founded in 2014 by patent attorney Vanessa Otero with the goal of combating political polarization. Ad Fontes Media uses a panel of analysts across the political spectrum to evaluate articles for the Chart.
| Formation | 2014 |
|---|---|
| Founder | Vanessa Otero |
| Legal status | Active |
| Products | Media Bias Chart |
| Website | www |
History
.jpg.webp)
Ad Fontes Media has its origins in a blog called All Generalizations are False which was written by patent attorney Vanessa Otero from Denver, Colorado. Otero first published the Media Bias Chart, a graphic which helped viewers visualize media bias in the United States, on the blog. The Media Bias Chart became a viral phenomenon on the Imgur image sharing service in December 2016,[1] and Otero founded Ad Fontes Media to serve as the publisher of the chart.[2] One of Otero's reasons for creating the organization was that "many sources people consider to be 'news sources' are actually dominated by analysis and opinion pieces," and that "extreme sources play on people's worst instincts, like fear and tribalism, and take advantage of people's confirmation biases."[3] In an interview with Newsy, she stated that "If people understood that the sources they are consuming are actively making them angrier and polarizing them, then they might choose to consume less of that."[4]
In 2018, Ad Fontes successfully launched a crowdfunding campaign to improve the technology behind the chart, increase the number of analysts, and make the site's methodology more transparent.[4] As of September 2020, the organization had a team of around twenty, most of whom were independent contractors, working as analysts of various news sources.[5][6][7]
Media Bias Chart
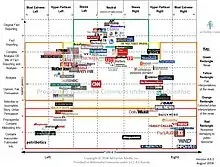
The Media Bias Chart by Ad Fontes Media rates various media sources on two different scales: political bias (politically left to politically right) on the horizontal axis and reliability on the vertical axis (fact reporting to sharing completely false information). On the chart, sources are concentrated in an "inverted-U" shape. Sources at the peak of the "U" are considered mostly reliable and objective, while sources along the left and right sides generally have a bias and/or a questionable reliability score. Furthermore, sources along the extreme low ends of the left and right sides often contain factually inaccurate information and propaganda. [8]
Ad Fontes Media has two different types of bias charts on their page. These types are the Static Charts and then the Interactive Media Bias Chart. The Static Charts are charts that have data available from a specific point in time. The first static chart debuted in 2016 as version 1.0. Certain static charts have various updated forms of the same version where they have a ".1" after the original number. The most recent example is Static Chart 6.1, updated in November of 2020 from version 6.0, originally posted in June of 2020. [9]
The Interactive Media Bias Chart is the main chart that factors in data from the older Static Charts, as well as current data. These factors makes it the most available up to date chart. This interactive version also allows users to zoom in and out, click directly on individual news companies to see their scores, filter various controls such as the accuracy and bias range, and see where individual articles were ranked. [10]
Ad Fontes is non-partisan.[11] During the September 2020 media bias project, nearly 1800 individual articles and TV news shows were rated by at least three analysts with different political views (left, right and center). There were 20 analysts, each reviewed about 370 articles and about 17 TV shows. Each analyst rated approximately three articles from each of the over 100 news sources available for viewing on the Chart. As a result, there were nearly 7,000 individual ratings.[5]
Otero sees the Media Bias Chart as an "anchor" that counteracts political polarization in news media, and aspires for Ad Fontes to become a "Consumer Reports for media ratings".[4] She compared low-quality news sources to junk food,[12] and described sources with extreme bias as "very toxic and damaging to the country".[3]
Reception
In 2018, a Columbia Journalism Review article questioned the thoroughness of the Media Bias Chart and similar initiatives, stating that "the five to 20 stories typically judged on these sites represent but a drop of mainstream news outlets' production".[13]
News sources that were rated poorly on the Media Bias Chart have been critical of the chart. Alex Jones, the founder of right-wing conspiracy theory site InfoWars, said Ad Fontes' chart represented the "dying dinosaur media's extreme liberal bias" after the chart classified InfoWars as "nonsense damaging to public discourse".[3] InfoWars responded with a chart of their own, putting themselves as "independent" and representing "freedom" while labeling news sources like the Associated Press as "tyranny" and "state-run corporate/foreign influences"; InfoWars's chart was widely criticized by journalists on Twitter.[3][14]
See also
References
- Little, Hannah Byrd (September–October 2018). "Media Literacy: A Moving Target" (PDF). Knowledge Quest. American Association of School Librarians. 48 (1): 18–20. Archived (PDF) from the original on December 25, 2020. Retrieved April 24, 2020.
- Peck, Andrea (June 2019). "A Boulder Lawyer Wants to Help You Become a Smarter News Consumer". 5280. Archived from the original on December 25, 2020. Retrieved May 14, 2020.
- Langlois, Shawn (April 21, 2018). "How biased is your news source? You probably won't agree with this chart". MarketWatch. Retrieved March 30, 2020.
- Thomas, Evan (December 28, 2018). "This Map Can Help Navigate The Partisan Media Landscape". Newsy. Archived from the original on December 25, 2020. Retrieved March 30, 2020.
- "Methodology". Ad Fontes Media. Archived from the original on December 25, 2020. Retrieved September 12, 2020.
- "Become an Analyst for the Media Bias Chart". Ad Fontes Media. Archived from the original on December 25, 2020. Retrieved April 26, 2020.
- "Do You Want to Be an Analyst for the Media Bias Chart?". Ad Fontes Media. December 1, 2018. Retrieved November 3, 2020.
- "This chart will tell you how biased your favorite news source is". Big Think. April 3, 2020. Archived from the original on December 25, 2020. Retrieved December 7, 2020.
- Heldebrandt, Beth (December 3, 2019). "How a popular media bias chart determines what news can be trusted". Gateway Journalism Review. Retrieved December 7, 2020.
- Heldebrandt, Beth (December 3, 2019). "How a popular media bias chart determines what news can be trusted". Gateway Journalism Review. Retrieved December 8, 2020.
- Halpern, Sue (December 19, 2018). "The Search for Anti-Conservative Bias on Google". The New Yorker. Archived from the original on December 25, 2020. Retrieved March 30, 2020.
- Jojola, Jeremy (February 10, 2020). "We set up 3 laptops with 3 different newsfeeds. Here's what we've seen so far". 9 News. Archived from the original on December 25, 2020. Retrieved March 31, 2020.
- Wilner, Tamar (January 9, 2018). "We can probably measure media bias. But do we want to?". Columbia Journalism Review. Archived from the original on December 25, 2020. Retrieved March 31, 2020.
- Tani, Maxwell (December 14, 2016). "Outlandish InfoWars chart attempts to classify media outlets by how 'tyrannical' or 'independent' they are". Business Insider. Archived from the original on December 25, 2020. Retrieved March 30, 2020.