Coast
The coast, also known as the coastline or seashore, is defined as the area where land meets the sea or ocean,[1] or as a line that forms the boundary between the land and the ocean or a lake.[2] Earth has around 620,000 kilometres (390,000 mi) of coastline. Because coasts are constantly changing, a coastline's exact perimeter cannot be determined; this measurement challenge is called the coastline paradox. The term coastal zone is used to refer to a region where interactions of sea and land processes occur.[3] Both the terms coast and coastal are often used to describe a geographic location or region located on a coastline (e.g., New Zealand's West Coast, or the East, West, and Gulf Coast of the United States.)
Coasts are important zones in natural ecosystems, often home to a wide range of biodiversity, and important zones such as wetlands which are important for bird populations or mangroves or seagrass which provide nursery habitat for fish or other aquatic species. Some coasts fronts on the open ocean and are called pelagic coast while other coasts are more sheltered coast in a gulf or bay. A shore, on the other hand, may refer to parts of land adjoining any large body of water, including oceans (seashore) and lakes (lake shore).
While there is general agreement in the scientific community regarding the definition of a coast, in the political sphere, the delineation of the extents of a coast differ according to jurisdiction. Government authorities in various countries may define coast differently for economic and social policy reasons. According to the UN atlas, 44% of all people live within 150 km (93 mi) of the sea.[4] Because of their importance in society and high concentration of population, the coast is important for major parts of the global food and economic system. Important human activities happen in port cities, fisheries, and other spaces beaches and seaside resorts which are used for tourism.
However, the economic importance of coasts makes many of these communities vulnerable to climate change which causes changes in extreme weather and sea level rise and related issues such as coastal erosion, saltwater intrusion and coastal flooding.[5] Other coastal issues, such as marine pollution and debris and marine ecosystem destruction, further complicate the human uses of the coast and threaten coastal ecosystems.[5] International attention to these issues has been captured in Sustainable Development Goal 14 "Life Below Water" which sets goals for international policy focused on preserving coastal ecosystems and supporting more sustainable economic practices for coastal communities.[6]
Formation
Tides often determine the range over which sediment is deposited or eroded. Areas with high tidal ranges allow waves to reach farther up the shore, and areas with lower tidal ranges produce deposition at a smaller elevation interval. The tidal range is influenced by the size and shape of the coastline. Tides do not typically cause erosion by themselves; however, tidal bores can erode as the waves surge up river estuaries from the ocean.[7]
Waves erode coastline as they break on shore releasing their energy; the larger the wave the more energy it releases and the more sediment it moves. Coastlines with longer shores have more room for the waves to disperse their energy, while coasts with cliffs and short shore faces give little room for the wave energy to be dispersed. In these areas, the wave energy breaking against the cliffs is higher, and air and water are compressed into cracks in the rock, forcing the rock apart, breaking it down. Sediment deposited by waves comes from eroded cliff faces and is moved along the coastline by the waves. This forms an abrasion or cliffed coast.
Sediment deposited by rivers is the dominant influence on the amount of sediment located on a coastline.[8] Today riverine deposition at the coast is often blocked by dams and other human regulatory devices, which remove the sediment from the stream by causing it to be deposited inland.
Like the ocean which shapes them, coasts are a dynamic environment with constant change. The Earth's natural processes, particularly sea level rises, waves and various weather phenomena, have resulted in the erosion, accretion and reshaping of coasts as well as flooding and creation of continental shelves and drowned river valleys (rias).
Environmental importance
Coasts and their adjacent areas on and off shore are an important part of a local ecosystem. The mixture of fresh water and salt water (brackish water) in estuaries provides many nutrients for marine life. Salt marshes and beaches also support a diversity of plants, animals and insects crucial to the food chain.
The high level of biodiversity creates a high level of biological activity, which has attracted human activity for thousands of years.
Coasts also create essential material for organisms to live by, including estuaries, wetland, seagrass, coral reefs, and mangroves. They support 85 percent of U.S. migratory birds. Coasts also provide a habitat for sea turtles, marine mammals, and coral reefs.[10]
Human impacts
Human uses of coasts
More and more of the world's people live in coastal regions.[11] Many major cities are on or near good harbors and have port facilities. Some landlocked places have achieved port status by building canals.
Nations defend their coasts against military invaders, smugglers and illegal migrants. Fixed coastal defenses have long been erected in many nations, and coastal countries typically have a navy and some form of coast guard.
Tourism
Coasts, especially those with beaches and warm water, attract tourists often leading to the development of seaside resort communities. In many island nations such as those of the Mediterranean, South Pacific and Caribbean, tourism is central to the economy. Coasts offer recreational activities such as swimming, fishing, surfing, boating, and sunbathing.
Growth management and coastal managementcan be a challenge for coastal local authorities who often struggle to provide the infrastructure required by new residents, and poor management practices of construction often leave these communities and infrastructure vulnerable to processes like coastal erosion and sea level rise. In many of these communities, management practices such as beach nourishment or when the coastal infrastructure is no longer financially sustainable, managed retreat to remove communities from the coast.
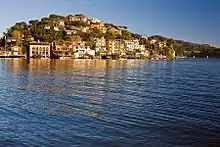 Houses close to the coast, like these in Tiburon, California, may be especially desirable properties.
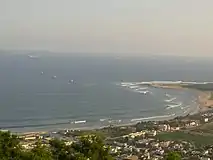 View of sea coast from top of a hill at Visakhapatnam in India
Threats to a coast
Coasts also face many human-induced environmental impacts. principal among which are sea level rise, and associated issues like coastal erosion and saltwater intrusion, and pollution, such as oil spills or marine debris contaminating coasts with plastic other trash.
Climate change
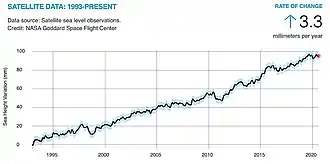
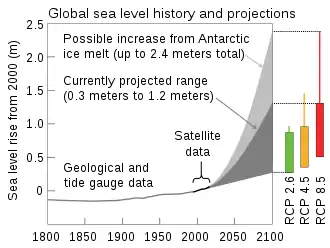
Global sea level rise began around the start of the 20th century. Between 1900 and 2016, the globally averaged sea level rose by 16–21 cm (6.3–8.3 in).[14] More precise data gathered from satellite radar measurements reveal an accelerating rise of 7.5 cm (3.0 in) from 1993 to 2017,[15]:1554 which is a trend of roughly 30 cm (12 in) per century. This acceleration is due mostly to human-caused global warming, which is driving thermal expansion of seawater and the melting of land-based ice sheets and glaciers.[16] Between 1993 and 2018, thermal expansion of the oceans contributed 42% to sea level rise; the melting of temperate glaciers, 21%; Greenland, 15%; and Antarctica, 8%.[15]:1576 Climate scientists expect the rate to further accelerate during the 21st century.[17]:62
Projecting future sea level is challenging, due to the complexity of many aspects of the climate system. As climate research into past and present sea levels leads to improved computer models, projections have consistently increased. In 2007, the Intergovernmental Panel on Climate Change (IPCC) projected a high end estimate of 60 cm (2 ft) through 2099,[18] but their 2014 report raised the high-end estimate to about 90 cm (3 ft).[19] A number of later studies have concluded that a global sea level rise of 200 to 270 cm (6.6 to 8.9 ft) this century is "physically plausible".[20][15][21] A conservative estimate of the long-term projections is that each Celsius degree of temperature rise triggers a sea level rise of approximately 2.3 meters (4.2 ft/degree Fahrenheit) over a period of two millennia (2,000 years): an example of climate inertia.[14] In February 2021, a paper published in Ocean Science suggested that past projections for global sea level rise by 2100 reported by the IPCC were likely conservative, and that sea levels will rise more than previously expected.[22]
The sea level will not rise uniformly everywhere on Earth, and it will even drop slightly in some locations, such as the Arctic.[23] Local factors include tectonic effects and subsidence of the land, tides, currents and storms. Sea level rises can affect human populations considerably in coastal and island regions.[24] Widespread coastal flooding is expected with several degrees of warming sustained for millennia.[25] Further effects are higher storm-surges and more dangerous tsunamis, displacement of populations, loss and degradation of agricultural land and damage in cities.[26][27][28] Natural environments like marine ecosystems are also affected, with fish, birds and plants losing parts of their habitat.[29]
Societies can adapt to sea level rise in three different ways: implement managed retreat, accommodate coastal change, or to protect against sea level rise through hard-construction practices like seawalls or soft approaches such as dune rehabilitation and beach nourishment. Sometimes these adaptation strategies go hand in hand, but at other times choices have to be made among different strategies.[30] For some human environments, such as so called sinking cities, adaptation to sea level rise may be compounded by other environmental issues such as subsidence. Natural ecosystems typically adapt to rising sea levels by moving inland; however, they might not always be able to do so, due to natural or artificial barriers.[31]Pollution
Pollution can occur from a number of sources: garbage and industrial debris; the transportation of petroleum in tankers, increasing the probability of large oil spills; small oil spills created by large and small vessels, which flush bilge water into the ocean.
Ecosystem destruction
Fishing has declined due to habitat degradation, overfishing, trawling, bycatch and climate change. Since the growth of global fishing enterprises after the 1950s, intensive fishing has spread from a few concentrated areas to encompass nearly all fisheries. The scraping of the ocean floor in bottom dragging is devastating to coral, sponges and other long-lived species that do not recover quickly. This destruction alters the functioning of the ecosystem and can permanently alter species' composition and biodiversity. Bycatch, the capture of unintended species in the course of fishing, is typically returned to the ocean only to die from injuries or exposure. Bycatch represents about a quarter of all marine catch. In the case of shrimp capture, the bycatch is five times larger than the shrimp caught.
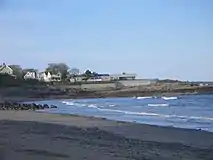 A settled coastline in Marblehead, Massachusetts. Once a fishing port, the harbor is now dedicated to tourism and pleasure boating. Observe that the sand and rocks have been darkened by oil slick up to the high-water line.
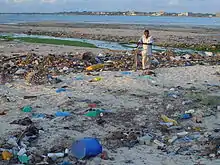 This stretch of coast in Tanzania's capital Dar es Salaam serves as a public waste dump.
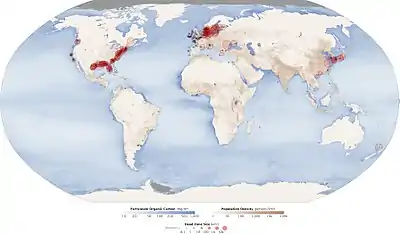 Dead zones occur when phosphorus and nitrogen from fertilizers cause excessive growth of microorganisms, which depletes oxygen and kills fauna.
Types
Emergent coastline
According to one principle of classification, an emergent coastline is a coastline which has experienced a fall in sea level, because of either a global sea level change, or local uplift. Emergent coastlines are identifiable by the coastal landforms, which are above the high tide mark, such as raised beaches. In contrast, a submergent coastline is one where the sea level has risen, due to a global sea level change, local subsidence, or isostatic rebound. Submergent coastlines are identifiable by their submerged, or "drowned" landforms, such as rias (drowned valleys) and fjords.
Concordant coastline
According to a second principle of classification, a concordant coastline is a coastline where bands of different rock types run parallel to the shore. These rock types are usually of varying resistance, so the coastline forms distinctive landforms, such as coves. Discordant coastlines feature distinctive landforms because the rocks are eroded by ocean waves. The less resistant rocks erode faster, creating inlets or bay; the more resistant rocks erode more slowly, remaining as headlands or outcroppings.
Other coastal categories
- A cliffed coast or abrasion coast is one where marine action has produced steep declivities known as cliffs.
- A flat coast is one where the land gradually descends into the sea.
- A graded shoreline is one where wind and water action has produced a flat and straight coastline.
Landforms
The following articles describe some coastal landforms:
Cliff erosion
- Much of the sediment deposited along a coast is the result of erosion of a surrounding cliff, or bluff. Sea cliffs retreat landward because of the constant undercutting of slopes by waves. If the slope/cliff being undercut is made of unconsolidated sediment it will erode at a much faster rate then a cliff made of bedrock.[8]
- A natural arch is formed when a headland is eroded through by waves.
- Sea caves are made when certain rock beds are more susceptible to erosion than the surrounding rock beds because of different areas of weakness. These areas are eroded at a faster pace creating a hole or crevice that, through time, by means of wave action and erosion, becomes a cave.
- A stack is formed when a headland is eroded away by wave and wind action.
- A stump is a shortened sea stack that has been eroded away or fallen because of instability.
- Wave-cut notches are caused by the undercutting of overhanging slopes which leads to increased stress on cliff material and a greater probability that the slope material will fall. The fallen debris accumulates at the bottom of the cliff and is eventually removed by waves.
- A wave-cut platform forms after erosion and retreat of a sea cliff has been occurring for a long time. Gently sloping wave-cut platforms develop early on in the first stages of cliff retreat. Later, the length of the platform decreases because the waves lose their energy as they break further off shore.[8]
Coastal features formed by sediment
Coastal features formed by another feature
Other features on the coast
Geologic processes
The following articles describe the various geologic processes that affect a coastal zone:
Wildlife
Animals
Animals that live in coastal areas include puffins, sea turtles and rockhopper penguins, among many others. Sea snails and various kinds of barnacles live on the coast and scavenge on food deposited by the sea. Most coastal animals are used to humans in developed areas, such as dolphins and seagulls who eat food thrown for them by tourists. Since the coastal areas are all part of the littoral zone, there is a profusion of marine life found just off-coast.
There are many kinds of seabirds on the coast. Pelicans and cormorants join up with terns and oystercatchers to forage for fish and shellfish on the coast. There are sea lions on the coast of Wales and other countries.
Plants
Coastal areas are famous for their kelp beds. Kelp is a fast-growing seaweed that grows up to a metre a day. Corals and sea anemones are true animals, but live a lifestyle similar to that of plants. Mangroves, seagrasses and salt marsh are important coastal vegetation types in tropical and temperate environments respectively.
Statistics
Coastline paradox
Shortly before 1951, Lewis Fry Richardson, in researching the possible effect of border lengths on the probability of war, noticed that the Portuguese reported their measured border with Spain to be 987 km, but the Spanish reported it as 1214 km. This was the beginning of the coastline problem, which is a mathematical uncertainty inherent in the measurement of boundaries that are irregular.[32]
The prevailing method of estimating the length of a border (or coastline) was to lay out n equal straight-line segments of length ℓ with dividers on a map or aerial photograph. Each end of the segment must be on the boundary. Investigating the discrepancies in border estimation, Richardson discovered what is now termed the Richardson Effect: the sum of the segments is inversely proportional to the common length of the segments. In effect, the shorter the ruler, the longer the measured border; the Spanish and Portuguese geographers were simply using different-length rulers.
The result most astounding to Richardson is that, under certain circumstances, as ℓ approaches zero, the length of the coastline approaches infinity. Richardson had believed, based on Euclidean geometry, that a coastline would approach a fixed length, as do similar estimations of regular geometric figures. For example, the perimeter of a regular polygon inscribed in a circle approaches the circumference with increasing numbers of sides (and decrease in the length of one side). In geometric measure theory such a smooth curve as the circle that can be approximated by small straight segments with a definite limit is termed a rectifiable curve.
Measuring a coastline
More than a decade after Richardson completed his work, Benoit Mandelbrot developed a new branch of mathematics, fractal geometry, to describe just such non-rectifiable complexes in nature as the infinite coastline.[33] His own definition of the new figure serving as the basis for his study is:[34]
I coined fractal from the Latin adjective fractus. The corresponding Latin verb frangere means "to break:" to create irregular fragments. It is therefore sensible ... that, in addition to "fragmented" ... fractus should also mean "irregular."
A key property of the fractal is self-similarity; that is, at any scale the same general configuration appears. A coastline is perceived as bays alternating with promontories. In the hypothetical situation that a given coastline has this property of self-similarity, then no matter how greatly any one small section of coastline is magnified, a similar pattern of smaller bays and promontories superimposed on larger bays and promontories appears, right down to the grains of sand. At that scale the coastline appears as a momentarily shifting, potentially infinitely long thread with a stochastic arrangement of bays and promontories formed from the small objects at hand. In such an environment (as opposed to smooth curves) Mandelbrot asserts[33] "coastline length turns out to be an elusive notion that slips between the fingers of those who want to grasp it."
There are different kinds of fractals. A coastline with the stated property is in "a first category of fractals, namely curves whose fractal dimension is greater than 1." That last statement represents an extension by Mandelbrot of Richardson's thought. Mandelbrot's statement of the Richardson Effect is:[35]

where L, coastline length, a function of the measurement unit, ε, is approximated by the expression. F is a constant and D is a parameter that Richardson found depended on the coastline approximated by L. He gave no theoretical explanation but Mandelbrot identified D with a non-integer form of the Hausdorff dimension, later the fractal dimension. Rearranging the right side of the expression obtains:

where Fε−D must be the number of units ε required to obtain L. The fractal dimension is the number of the dimensions of the figure being used to approximate the fractal: 0 for a dot, 1 for a line, 2 for a square. D in the expression is between 1 and 2, for coastlines typically less than 1.5. The broken line measuring the coast does not extend in one direction nor does it represent an area, but is intermediate. It can be interpreted as a thick line or band of width 2ε. More broken coastlines have greater D and therefore L is longer for the same ε. Mandelbrot showed that D is independent of ε.
See also
- Ballantine scale
- Coastal and Estuarine Research Federation
- Coastal biogeomorphology
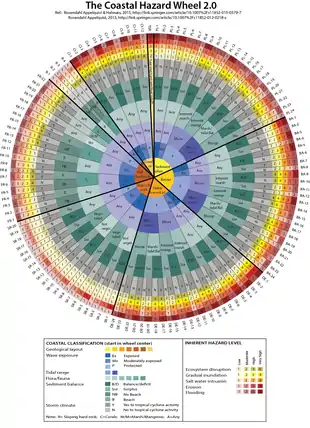
- Coastal development hazards
- Coastline of the North Sea
- European Atlas of the Seas
- How Long Is the Coast of Britain? Statistical Self-Similarity and Fractional Dimension
- Land reclamation
- List of beaches
- List of countries by length of coastline
- List of U.S. states by coastline
- Marine debris
- National Oceanic and Atmospheric Administration Climate and Societal Interactions Program
- Nautical chart
- Pole of inaccessibility
- Seaside resort
- Tombolo
Notes
- "Coast". The American Heritage Dictionary of the English Language (4th ed.). 2000. Archived from the original on 2009-02-01. Retrieved 2008-12-11.
- "Coastline definition". Merriam-Webster. Retrieved 2015-06-13.
- Nelson, Stephen A. (2007). "Coastal Zones". Archived from the original on 2013-03-16. Retrieved 2008-12-11.
- "UN Atlas". Archived from the original on 2 November 2013. Retrieved 31 October 2013.
- "Climate change and the coasts « World Ocean Review". Retrieved 2020-12-19.
- United Nations (2017) Resolution adopted by the General Assembly on 6 July 2017, Work of the Statistical Commission pertaining to the 2030 Agenda for Sustainable Development (A/RES/71/313)
- Davidson, Reed & Davis 2002, p. 421.
- Easterbrook 1999.
- "The Indian Ocean Coast of Somalia". Marine Pollution Bulletin. 41 (1-6): 141–159. December 2000. doi: 10.1016/S0025-326X(00)00107-7
- US EPA, ORD (2017-11-02). "Coastal Waters". US EPA. Retrieved 2020-05-04.
- Goudarzi, Sara (July 18, 2006). "Flocking to the Coast: World's Population Migrating into Danger". Live Science. Retrieved 2008-12-14.
- "January 2017 analysis from NOAA: Global and Regional Sea Level Rise Scenarios for the United States" (PDF).
- 27-year Sea Level Rise - TOPEX/JASON NASA Visualization Studio, 5 November 2020.
 This article incorporates text from this source, which is in the public domain.
 - USGCRP (2017). "Climate Science Special Report. Chapter 12: Sea Level Rise". science2017.globalchange.gov. Retrieved 2018-12-27.
- WCRP Global Sea Level Budget Group (2018). "Global sea-level budget 1993–present". Earth System Science Data. 10 (3): 1551–1590. Bibcode:2018ESSD...10.1551W. doi:10.5194/essd-10-1551-2018.
This corresponds to a mean sea-level rise of about 7.5 cm over the whole altimetry period. More importantly, the GMSL curve shows a net acceleration, estimated to be at 0.08mm/yr2.
- Mengel, Matthias; Levermann, Anders; Frieler, Katja; Robinson, Alexander; Marzeion, Ben; Winkelmann, Ricarda (8 March 2016). "Future sea level rise constrained by observations and long-term commitment". Proceedings of the National Academy of Sciences. 113 (10): 2597–2602. Bibcode:2016PNAS..113.2597M. doi:10.1073/pnas.1500515113. PMC 4791025. PMID 26903648.
- Climate Change 2014 Synthesis Report Fifth Assessment Report, AR5 (Report). Intergovernmental Panel on Climate Change. 2014. Under all RCP scenarios, the rate of sea level rise will very likely exceed the rate of 2.0 [1.7–2.3] mm/yr observed during 1971–2010
- IPCC, "Summary for Policymakers", Contribution of Working Group I to the Fourth Assessment Report of the Intergovernmental Panel on Climate Change, 2007, page 13-14"Models used to date do not include uncertainties in climate-carbon cycle feedback nor do they include the full effects of changes in ice sheet flow, because a basis in published literature is lacking."
- Mooney, Chris. "Scientists keep upping their projections for how much the oceans will rise this century". Washington Post.
- Bamber, Jonathan L.; Oppenheimer, Michael; Kopp, Robert E.; Aspinall, Willy P.; Cooke, Roger M. (June 4, 2019). "Ice sheet contributions to future sea-level rise from structured expert judgment". Proceedings of the National Academy of Sciences. 116 (23): 11195–11200. doi:10.1073/pnas.1817205116. PMID 31110015 – via www.pnas.org.
- Global and Regional Sea Level Rise Scenarios for the United States (PDF) (Report) (NOAA Technical Report NOS CO-OPS 083 ed.). National Oceanic and Atmospheric Administration. January 2017. p. vi. Retrieved 24 August 2018."The projections and results presented in several peer-reviewed publications provide evidence to support a physically plausible GMSL rise in the range of 2.0 meters (m) to 2.7 m, and recent results regarding Antarctic ice-sheet instability indicate that such outcomes may be more likely than previously thought."
- Grinsted, Aslak; Christensen, Jens Hesselbjerg (2021-02-02). "The transient sensitivity of sea level rise". Ocean Science. 17 (1): 181–186. doi:10.5194/os-17-181-2021. ISSN 1812-0784.
- "The strange science of melting ice sheets: three things you didn't know". The Guardian. 12 September 2018.
- Bindoff, N.L.; Willebrand, J.; Artale, V.; Cazenave, A.; Gregory, J.; Gulev, S.; Hanawa, K.; Le Quéré, C.; Levitus, S.; Nojiri, Y.; Shum, C.K.; Talley L.D.; Unnikrishnan, A. (2007), "Section 5.5.1: Introductory Remarks", in IPCC AR4 WG1 (ed.), Chapter 5: Observations: Ocean Climate Change and Sea Level, ISBN 978-0-521-88009-1, retrieved 25 January 2017
- Box SYN-1: Sustained warming could lead to severe impacts, p. 5, in: Synopsis, in National Research Council 2011
- IPCC TAR WG1 2001.
- "Sea level to increase risk of deadly tsunamis". UPI. 2018.
- Holder, Josh; Kommenda, Niko; Watts, Jonathan; Holder, Josh; Kommenda, Niko; Watts, Jonathan. "The three-degree world: cities that will be drowned by global warming". The Guardian. ISSN 0261-3077. Retrieved 2018-12-28.
- "Sea Level Rise". National Geographic. January 13, 2017.
- Thomsen, Dana C.; Smith, Timothy F.; Keys, Noni (2012). "Adaptation or Manipulation? Unpacking Climate Change Response Strategies". Ecology and Society. 17 (3). doi:10.5751/es-04953-170320. JSTOR 26269087.
- "Sea level rise poses a major threat to coastal ecosystems and the biota they support". birdlife.org. Birdlife International. 2015.
- Richardson, Lewis Fry (1993). "Fractals". In Ashford, Oliver M.; Charnock, H.; Drazin, P. G.; et al. (eds.). The Collected Papers of Lewis Fry Richardson: Meteorology and numerical analysis. 1. Cambridge University Press. pp. 45–46. ISBN 0-521-38297-1.
- Mandelbrot 1983, p. 28.
- Mandelbrot 1983, p. 1.
- Mandelbrot 1983, pp. 29–31.
References
- Burke, Lauretta A.; Kura, Yumiko; Kassem, Ken; Revenga, Carmen; Spalding, Mark; McAllister, Don (2001). "Coastal Ecosystems" (PDF). In Hutter, Carolynne (ed.). Pilot Analysis of Global Ecosystems. World Resources Institute. ISBN 978-1-56973-458-2. Archived from the original (PDF) on 2003-04-08.
- Davidson, Jon P.; Reed, Walter E.; Davis, Paul M. (2002). Exploring Earth: An Introduction to Physical Geology. Upper Saddle River, NJ: Prentice-Hall Inc. ISBN 978-0-13-018372-9.
- Easterbrook, Don J. (1999). Surface Processes and Landforms (2 ed.). Upper Saddle River, NJ: Prentice-Hall Inc. ISBN 978-0-13-860958-0.
- Haslett, Simon K. (2009). Coastal Systems. introduction to environment (2nd ed.). New York: Routledge. ISBN 978-0-415-44060-8.
- Mandelbrot, Benoit B. (1982). "II.5 How long is the coast of Britain?". The Fractal Geometry of Nature. Macmillan. pp. 25–33. ISBN 978-0-7167-1186-5.
External links
| Wikimedia Commons has media related to Coasts. |
| Wikiquote has quotations related to: Coast |
| Look up coast in Wiktionary, the free dictionary. |
| Wikiversity has learning resources about Coast |
- "Wild Coast USA". Sierra Club. Archived from the original on 2008-05-09. Retrieved 2008-12-11.
- "Data Explorer". NOAA's National Ocean Service. Archived from the original on 2008-12-21. Retrieved 2008-12-11.
- Chisholm, Hugh, ed. (1911). . Encyclopædia Britannica. 6 (11th ed.). Cambridge University Press. p. 599.