Defect concentration diagram
The defect concentration diagram (also problem concentration diagram[1]) is a graphical tool that is useful in analyzing the causes of the product or part defects.[2] It is a drawing of the product (or other item of interest), with all relevant views displayed, onto which the locations and frequencies of various defects are shown.
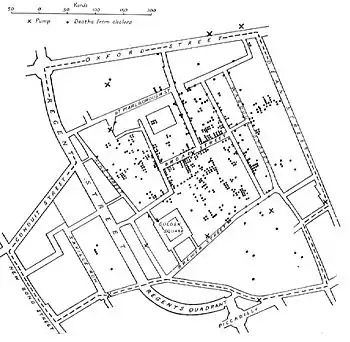
Concentration diagram of Cholera deaths 1854 in London (John Snow (1813-1858))
Usage
Defect concentration diagram is used effectively in the following situations:
- During data collection phase of problem identification.
- Analyzing a part or assembly for possible defects.
- Analyzing a product (or a part of a product) being manufactured with several defects.
Steps
There are a number of steps that are needed to be follow when constructing the defect concentration diagram:
References
- Bjørn Andersen, Tom Fagerhaug, and Marti Beltz, Problem Concentration Diagram, on https://ASQ.org; read 20. August 2015.
- Douglas Montgomery (2005). Introduction to Statistical Quality Control. John Wiley & Sons, Inc. ISBN 978-0-471-65631-9
This article is issued from Wikipedia. The text is licensed under Creative Commons - Attribution - Sharealike. Additional terms may apply for the media files.