Floristic Quality Assessment
Floristic Quality Assessment (FQA) is a tool used to assess an area's ecological integrity based on its plant species composition.[1] Floristic Quality Assessment was originally developed in order to assess the likelihood that impacts to an area "would be irreversible or irretrievable...to make standard comparisons among various open land areas, to set conservation priorities, and to monitor site management or restoration efforts."[2] The concept was developed by Gerould Wilhelm in the 1970s in a report on the natural lands of Kane County, Illinois[3] and codified for the Chicago Region in 1979.[4]
Coefficient of conservatism

Each plant species in a region is assigned a coefficient of conservatism, also known as a C-value, ranging between 0 and 10.[1] A plant species with a higher score (e.g. 10) has a lower tolerance to environmental degradation such as overgrazing or development and therefore is naturally restricted to undisturbed, remnant habitats. Non-native plants are either assigned a C-value of 0 or are excluded from assessments.[6] In the Chicago Region, 84% of the native plant species have a C-value of 4 or greater.[7] Plants with a C-value of 4 or greater rarely naturally move from a remnant area to surrounding degraded land.[7]
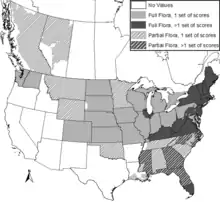
C-values are assigned within specific ecological and geographic regions by botanical experts familiar with the species' autecology within the respective regions.[8] As of February 2018, there were more than 50 different FQA databases ranging from the Gulf Coastal Plain to western Washington, though most databases represented regions in the eastern and central United States and Canada.[9][5]
The mean C-value () is calculated based on an inventory of plants. An area with a native mean C-value of 3.5 or higher likely has "sufficient floristic quality to be of at least marginal natural area quality."[2] Remnant natural areas with mean C-values of 4.0 or greater are unmitigable.[7]
Floristic Quality Index
The Floristic Quality Index (FQI) is calculated by multiplying the mean C value by the square root of the total number of species:
References
- Wilhelm, Gerould; Masters, Linda (June 1995). Floristic Quality Assessment in the Chicago Region and Application Computer Programs (Report). The Morton Arboretum.
- Swink, Floyd; Wilhelm, Gerould (1994). Plants of the Chicago Region.
- Wilhelm, Gerould S. (1977). Ecological assessment of open land areas in Kane County, Illinois (Report). Kane County Urban Development Division.
- Swink, Floyd; Wilhelm, Gerould (1979). Plants of the Chicago Region.
- Spyreas, Greg (2019). "Floristic Quality Assessment: a critique, a defense, and a primer". Ecosphere. 10 (8): e02825. doi:10.1002/ecs2.2825. ISSN 2150-8925.
- Freyman, William A.; Master, Linda A.; Packard, Stephen (2016). "The Universal Floristic Quality Assessment (FQA) Calculator: an online tool for ecological assessment and monitoring". Methods in Ecology and Evolution. 7 (3): 380–383. doi:10.1111/2041-210X.12491.
- Wilhelm, Gerould; Rericha, Laura (2017). Flora of the Chicago Region: A Floristic and Ecological Synthesis.
- Matthews, Jeffrey W.; Spyreas, Greg; Long, Colleen M. (May 2015). "A null model test of Floristic Quality Assessment: Are plant species' Coefficients of Conservatism valid?". Ecological Indicators. 52: 1–7. doi:10.1016/j.ecolind.2014.11.017.
- "Universal FQA". Retrieved 2018-02-16.