Fluorescence imaging
Fluorescence imaging is a type of non-invasive imaging technique that can help visualize biological processes taking place in a living organism. Images can be produced from a variety of methods including: microscopy, imaging probes, and spectroscopy.

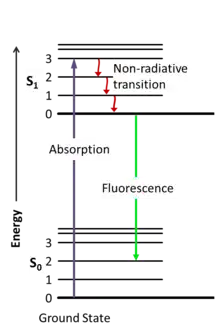
Fluorescence itself, is a form of luminescence that results from matter emitting light of a certain wavelength after absorbing electromagnetic radiation. Molecules that re-emit light upon absorption of light are called fluorophores.[1][2]
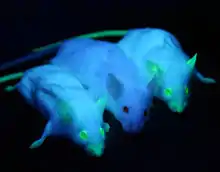
Fluorescence imaging photographs fluorescent dyes and fluorescent proteins to mark molecular mechanisms and structures. It allows one to experimentally observe the dynamics of gene expression, protein expression, and molecular interactions in a living cell.[3] It essentially serves as a precise, quantitative tool regarding biochemical applications.
A common misconception, fluorescence differs from bioluminescence by how the proteins from each process produce light. Bioluminescence is a chemical process that involves enzymes breaking down a substrate to produce light. Fluorescence is the physical excitation of an electron, and subsequent return to emit light.
Attributes
Fluorescence mechanism

When a certain molecule absorbs light, the energy of the molecule is briefly raised to a higher excited state. The subsequent return to ground state results in emission of fluorescent light that can be detected and measured. The emitted light, resulting from the absorbed photon of energy hv, has a specific wavelength. It is important to know this wavelength beforehand so that when an experiment is running, the measuring device knows what wavelength to be set at to detect light production. This wavelength is determined by the equation:
Where h = Planck's constant, and c = the speed of light. Typically a large scanning device or CCD is used here to measure the intensity and digitally photograph an image.[1]
Fluorescent dyes versus proteins
Fluorescent dyes, with no maturation time, offer higher photo stability and brightness in comparison to fluorescent proteins. In terms of brightness, luminosity is dependent on the fluorophores’ extinction coefficient or ability to absorb light, and its quantum efficiency or effectiveness at transforming absorbed light into fluorescently emitting luminescence. The dyes themselves are not very fluorescent, but when they bind to proteins, they become more easily detectable. One example, NanoOrange, binds to the coating and hydrophobic regions of a protein while being immune to reducing agents. Regarding proteins, these molecules themselves will fluorescence when they absorb a specific incident light wavelength. One example of this, green fluorescent protein (GFP), fluoresces green when exposed to light in the blue to UV range. Fluorescent proteins are excellent reporter molecules that can aid in localizing proteins, observing protein binding, and quantifying gene expression.[1]
Imaging range
Since some wavelengths of fluorescence are beyond the range of the human eye, charged-coupled devices (CCD) are used to accurately detect light and image the emission. This typically occurs in the 300 – 800 nm range. One of the advantages of fluorescent signaling is that intensity of emitted light behaves rather linearly in regards to the quantity of fluorescent molecules provided. This is obviously contingent that the absorbed light intensity and wavelength are constant. In terms of the actual image itself, it is usually in a 12-bit or 16-bit data format.[1]

Imaging systems
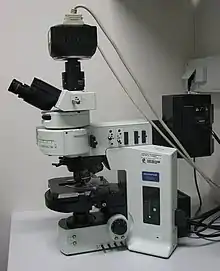
The main components of fluorescence imaging systems are:
- Excitation Source- a device that produces either a broad-wavelength source like UV light, or a narrow wavelength source like a laser.
- Light display optics- the mechanism of which light illuminates the sample. This is typically done through direct illumination of the sample.
- Light assortment optics- the collection method of the light itself. This typically constitutes lenses, mirrors, and filters.
- Filtration of emitted light- optical filters ensure that reflected and scattered light are not included with the fluorescence. The three classes of emission filters are long-pass, short-pass, and band-pass.
- Detection, amplification, and visualization- either photomultiplier (PMT) or charge-couple device (CCD) is used to detect and quantify emitted protons
Applications
- In PCR (agarose gel electrophoresis)- SYBR Green is a very common dye that binds to DNA and is used to visualize DNA bands in an agarose gel. The dye absorbs blue light and fluoresces green for an imaging system to capture.
- Blotting (Western, Northern, and Southern)- fluorochromes can bind to antibodies, RNA, and DNA to fluoresce and quantify data
- DNA Sequencing- Sanger Sequencing is a common form of nucleic acid detection that may use fluorescently labeled ddNTPs to image fluorescence peaks
- Fluorescence image guided surgery- is a medical imaging approach that fluorescently labels a mass to aid in navigation. For example, indocyanine green can be used to detect lymph nodes in cancer patients.[4]
- Fluorescence imaging with one nanometer accuracy (FIONA)- utilizes total internal reflection illumination to reduce noise and increase brightness of fluorophores
- Calcium imaging- technique that utilizes fluorescent molecules called calcium indicators that change in fluorescence when bound to Ca2+ ions. This is a key part in seeing when cells are active in the nervous system.[5]
.jpg.webp)
Types of microscopy
A different array of microscope techniques can be employed to change the visualization and contrast of an image. Each method comes with pros and cons, but all utilize the same mechanism of fluorescence to observe a biological process.
- Total internal reflection fluorescence microscopy- is a microscopy technique that uses evanescent waves to selectively observe the fluorescence of a single molecule.[6]
- Light sheet fluorescence microscopy- is a fluorescence microscopy technique that illuminates a thin slice of a sample at a perpendicular angle of examination.[7]
- Fluorescence-lifetime imaging microscopy- is an imaging technique that records changes in fluorescence over time
Advantages
- Non-invasive- imaging in vivo can take place without having to puncture the skin
- Sensitive- probes are designed to be extremely sensitive to detecting biological molecules like DNA, RNA, and proteins.[1]
- Multi-labeling- multiple fluorochromes can be detected within the samples allowing for an easy way to integrate standards and a control.
- Stability of labeled molecules- fluorescently labeled molecules used in imaging can be stored for months while other molecules like ones that are radiolabeled, will decay over a few days.[7]
- Relatively safe to handle- most fluorophores can be safely and sufficiently handled with gloves, while for example, radioisotopes may require lead shields or other radiation protection.[7]
- Simple disposal- many fluorophores require minimal disposal methods while radioactive wastes require regulated disposal and long-term handling. This also aids in lowering the cost needed to utilize these products.

Disadvantages
- Photobleaching- is a prevalent issue with fluorophores where the constant cycling between ground state and excited state damages the molecule and reduces its intensity.[7]
- Environmental susceptibility- environmental factors like temperature, ion concentration, and pH can affect the efficiency and emission of fluorochromes
- Toxicity- some fluorochromes can be toxic to cells, to tissues, in vivo, or by producing mutations.[8]
- Limited resolving power- fluorescence microscopes are limited in their ability to distinguish close objects at the macroscopic level. In comparison, electron microscopes for example, have the capacity to resolve at a much smaller range.
- Limited initial luminosity range- the incidence light source intensity has a limit and beyond this point can result in photodestruction of molecules.[1]
Overall, this form of imaging is extremely useful in cutting-edge research, with its ability to monitor biological processes. The progression from 2D fluorescent images to 3D ones has allowed scientists to better study spatial precision and resolution. In addition, with concentrated efforts towards 4D analysis, scientists are now able to monitor a cell in real time, enabling them to monitor fast acting processes.
Future directions

Developing more effective fluorescent proteins is a task that many scientists have taken up in order to improve imaging probe capabilities. Often, mutations in certain residues can significantly change the protein's fluorescent properties. For example, by mutating the F64L gene in jellyfish GFP, the protein is able to more efficiently fluoresce at 37 °C, an important attribute to have when growing cultures in a laboratory.[9] In addition to this, genetic engineering can produce a protein that emits light at a better wavelength or frequency.[9] In addition, the environment itself can play a crucial role. Fluorescence lifetime can be stabilized in a polar environment.
Mechanisms that have been well described but not necessarily incorporated into practical applications hold promising potential for fluorescence imaging. Fluorescence resonance energy transfer (FRET) is an extremely sensitive mechanism that produce signaling molecules in the range of 1-10 nm.[6]
Improvements in the techniques that constitute fluorescence processes is also crucial towards more efficient designs. Fluorescence correlation spectroscopy (FCS) is an analysis technique that observes the fluctuation of fluorescence intensity. This analysis is a component of many fluorescence imaging machines and improvements in spatial resolution could improve the sensitivity and range.[6]
Development of more sensitive probes and analytical techniques for laser induced fluorescence can allow for more accurate, up-to-date experimental data.
References
- "Fluorescence Imaging Principles and Methods" (PDF). Boston University. December 2012.
- Sirbu, Dumitru; Luli, Saimir; Leslie, Jack; Oakley, Fiona; Benniston, Andrew C. (2019-05-17). "Enhanced in vivo Optical Imaging of the Inflammatory Response to Acute Liver Injury in C57BL/6 Mice Using a Highly Bright Near-Infrared BODIPY Dye". ChemMedChem. 14 (10): 995–999. doi:10.1002/cmdc.201900181. ISSN 1860-7179.
- "Fluorescence imaging - Latest research and news | Nature". www.nature.com. Retrieved 2019-04-18.
- Nagaya, Tadanobu; Nakamura, Yu A.; Choyke, Peter L.; Kobayashi, Hisataka (2017-12-22). "Fluorescence-Guided Surgery". Frontiers in Oncology. 7: 314. doi:10.3389/fonc.2017.00314. ISSN 2234-943X. PMC 5743791. PMID 29312886.
- "Fluorescence microscopy - pros and cons :: DNA Learning Center". www.dnalc.org. Retrieved 2019-04-18.
- Haustein, Elke; Schwille, Petra (September 2007). "Trends in fluorescence imaging and related techniques to unravel biological information". HFSP Journal. 1 (3): 169–180. doi:10.2976/1.2778852. ISSN 1955-2068. PMC 2640989. PMID 19404444.
- Forero-Shelton, Manu (April 2019). "Peering into cells at high resolution just got easier". Nature Methods. 16 (4): 293–294. doi:10.1038/s41592-019-0373-3. ISSN 1548-7105. PMID 30886415.
- Alford, Raphael; Simpson, Haley M.; Duberman, Josh; Hill, G. Craig; Ogawa, Mikako; Regino, Celeste; Kobayashi, Hisataka; Choyke, Peter L. (2009-11-01). "Toxicity of Organic Fluorophores Used in Molecular Imaging: Literature Review". Molecular Imaging. 8 (6): 7290.2009.00031. doi:10.2310/7290.2009.00031. ISSN 1536-0121.
- Piston, David W.; Davidson, Michael W.; Cranfill, Paula J.; Gilbert, Sarah G.; Kremers, Gert-Jan (2011-01-15). "Fluorescent proteins at a glance". J Cell Sci. 124 (2): 157–160. doi:10.1242/jcs.072744. ISSN 0021-9533. PMC 3037093. PMID 21187342.