GPlates
GPlates is open-source application software offering a novel combination of interactive plate-tectonic reconstructions, geographic information system (GIS) functionality and raster data visualization.
GPlates Logo | |
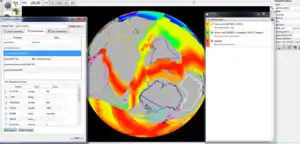 GPlates display agegrid and coastlines at 100 Ma | |
| Original author(s) | EarthByte Group |
|---|---|
| Developer(s) | The GPlates Development Team |
| Initial release | January 2006 |
| Stable release | 2.2.0
/ August 30, 2019 |
| Written in | C++ and Python |
| Operating system | Linux, Mac OS X, Microsoft Windows |
| Available in | English |
| Type | Geographic information system |
| License | GNU GPL version 2+ |
| Website | www |
History
The GPlates project was started by Professor Dietmar Müller in 2006. By the end of 2010, the GPlates 1.0.0 was released.
The latest release is GPlates 2.2 in August 2019. A user manual and tutorials are available online.[1][2]
Below is a list of major releases of GPlates.[3]
- 2008-05-23: GPlates 0.9.2
- 2009-06-17: GPlates 0.9.5
- 2010-12-20: GPlates 1.0.0
- 2011-05-21: GPlates 1.1
- 2012-01-30: GPlates 1.2
- 2013-05-29: GPlates 1.3
- 2014-04-18: GPlates 1.4
- 2015-02-14: GPlates 1.5
- 2016-02-04: pyGPlates beta revision 12 released
- 2016-11-18: GPlates 2.0.0
- 2018-08-08: pyGPlates beta revision 18 released
- 2018-08-08: GPlates 2.1.0
- 2019-08-30: GPlates 2.2.0
- 2020-08-18: PyGPlates beta revision 28 released
Functionality
GPlates enables both the visualization and the manipulation of plate-tectonic reconstructions and associated data through geological time:
- Load and save geological, geographic and tectonic feature data.
- Assign feature data to tectonic plates.
- Reconstruct feature data to past geological times.
- Query and edit feature properties and geometries.
- Modify reconstructions graphically.
- Visualize vector and raster data on the globe or in one of the map projections.
- Visualize sub-surface 3D scalar fields as isosurfaces or 2D cross-sections.
- Export reconstructed data as a time-sequence of exported files.
- Use plate polygons (with dynamic boundaries and deformation) to calculate velocity fields.
Contributors
GPlates is developed by an international team of scientists and professional software developers at:
- the EarthByte group in the school of Geosciences at the University of Sydney
- the Division of Geological and Planetary Sciences (GPS) at Caltech
with past contributions from:
- the Centre for Earth Evolution and Dynamics (CEED) at the Department of Geosciences, University of Oslo, Norway
- the Geodynamics Team at the Geological Survey of Norway (NGU)
Adoption
GPlates is used by geophysicists, students and researchers in academic institutions, government departments and industry. It has also gained currency in the creative worldbuilding community as a tool for maintaining realism or verisimilitude in geographic features.
Implementation
GPlates runs on Mac OS X, Microsoft Windows and Ubuntu. GPlates is written in C++ and uses OpenGL to render its 3D globe and 2D map views. It uses Qt as a GUI framework. The Boost C++ library has also been widely used. Other libraries include GDAL, CGAL, proj, qwt and GLEW.
GPGIM and GPML
GPlates uses the GPlates Geological Information Model (GPGIM) to represent geological data in a Plate tectonics context. The GPlates Markup Language (GPML) is an XML implementation of the GPGIM[4] derived from the Geography Markup Language (GML).
GPlates Python Binding
The GPlates Python library (pyGPlates) enables access to GPlates functionality via the Python programming language. It allows users to use GPlates in a programmatic way and hence provides much more flexibility than the GPlates desktop interface can offer. The pyGPlates is available for download. Reference documentation and tutorials are also available for download.
The PyGPlates beta revision 28 was released on 08 August 2020. This is the first version which supports Python3.
People
Developers
- John Cannon (active) EarthByte group, The University of Sydney
- John is the lead developer of GPlates.
- Michael Chin(Xiaodong Qin) (active) EarthByte group, The University of Sydney
- Robin Watson (inactive) Geodynamics team, Geological Survey of Norway
- Mark Turner (inactive)
- Enoch Lau (inactive)
- James Clark (inactive)
- James Boyden (inactive)
- Hamish Ivey-Law (inactive)
Scientists
- Professor Dietmar Müller
- Dietmar is the founder and current lead of the GPlates project.
- Professor Mike Gurnis
- Also a founder of the GPlates project.
- Dr. Maria Seton
- Dr. Simon Williams
Licensing
GPlates is released under GNU General Public License version 2.0 (GPLv2) and the source code can be found on SourceForge[5]
GPlates Portal
The GPlates Web Portal is a gateway to a series of GPlates-based web applications. The portal was launched in 2014.[6] Michael Chin is the architect and chief programmer. Initially the portal was hosted on nectar cloud. Later on, it was migrated to Amazon Elastic Compute Cloud. Below is a list of applications in GPlates Web Portal.
- 3D visualization of the Vertical Gravity Gradient Grid.[7]
- Reconstruct raster images through time.
- Data reconstruction and visualization service.
- Demonstrate how to use pyGPlates in IPython Notebook.
The Cesium Javascript library is used to render the 3D globe in a web browser.[8]
Media
- CNN (This map lets you see where your hometown was on the Earth millions of years ago)[9]
- The Guardian (The most detailed map of the ocean floor ever seen)[10]
- wired.com (Super-Detailed Interactive 3-D Seafloor Map)[11]
- Industry Advocate (Seafloor Mapping first)[12]
- Orma (Earth Without Oceans- Stunning New Interactive Map of the Earth's Seafloor)[13]
Select Publications
Below is a list of select publications of GPlates.
- Plate tectonic raster reconstruction in GPlates[14]
- Next-generation plate-tectonic reconstructions using GPlates[15]
- The GPlates Geological Information Model and Markup Language[16]
- An open-source software environment for visualizing and refining plate tectonic reconstructions using high-resolution geological and geophysical data sets[17]
- Plate Reconstructions with Continuously Closing Plates[18]
- Visualizing 3D mantle structure from seismic tomography and geodynamic model predictions of the India-Eurasia and East Asia convergence zone[19]
- Application of open-source software and high-resolution geophysical images to explore the plate tectonic evolution of Australia[20]
- A Custom Implementation for Visualizing Sub-surface 3D Scalar Fields in GPlates[21]
- The GPlates Portal: Cloud-based interactive 3D visualization of global geophysical and geological data in a web browser[22]
References
- "GPlates Tutorials". Retrieved 2015-09-19.
- "GPlates User Manual".
- "GPlates News".
- Qin, X.; Müller, R. D.; Cannon, J.; Landgrebe, T. C. W.; Heine, C.; Watson, R. J.; Turner, M. (2012). "GI - Abstract - The GPlates Geological Information Model and Markup Language". Geoscientific Instrumentation, Methods and Data Systems. 1 (2): 111–134. Bibcode:2012GI......1..111Q. doi:10.5194/gi-1-111-2012.
- "GPlates download". SourceForge.net. Retrieved 2015-09-19.
- "GPlates Portal". EarthByte. 2014-11-16. Retrieved 2015-09-19.
- http://topex.ucsd.edu/grav_outreach/
- "GPlates Portal - Cesium - WebGL Virtual Globe and Map Engine". Cesiumjs.org. Retrieved 2015-09-19.
- "This map lets you see where your hometown was on the Earth millions of years ago".
- "The most detailed map of the ocean floor ever seen | Technology". The Guardian. Retrieved 2015-09-19.
- "Super-Detailed Interactive 3-D Seafloor Map". Wired. 2014-10-09. Retrieved 2015-09-19.
- "Seafloor Mapping first". The Industry Advocate. 2015-08-12. Archived from the original on 2016-04-02. Retrieved 2015-09-19.
- "Earth Without Oceans- Stunning New Interactive Map of the Earth's Seafloor". Orma.com. Archived from the original on 2016-03-04. Retrieved 2015-09-19.
- Cannon, J.; Lau, E.; Müller, R. D. (2014). "Plate tectonic raster reconstruction in GPlates". Solid Earth. 5 (2): 741–755. Bibcode:2014SolE....5..741C. doi:10.5194/se-5-741-2014.
- Keller, G. Randy; Baru, Chaitanya, eds. (2011). Next-generation plate-tectonic reconstructions using GPlates - University Publishing Online. Ebooks.cambridge.org. doi:10.1017/CBO9780511976308. ISBN 9780511976308. Retrieved 2015-09-19.
- Qin, X.; Müller, R. D.; Cannon, J.; Landgrebe, T. C. W.; Heine, C.; Watson, R. J.; Turner, M. (2012). "The GPlates Geological Information Model and Markup Language". Geoscientific Instrumentation, Methods and Data Systems. 1 (2): 111–134. Bibcode:2012GI......1..111Q. doi:10.5194/gi-1-111-2012.
- "An open-source software environment for visualizing and refining plate tectonic reconstructions using high-resolution geological and geophysical data sets" (PDF).
- "Plate Reconstructions with Continuously Closing Plates" (PDF).
- Cannon, J.; Pfaffelmoser, T.; Zahirovic, S.; Müller, R.; Seton, M. (2012). "Visualizing 3D mantle structure from seismic tomography and geodynamic model predictions of the India-Eurasia and East Asia convergence zone" (PDF). AGU Fall Meeting Abstracts. 2012: T51E–2645. Bibcode:2012AGUFM.T51E2645C.
- "Application of open-source software and high-resolution geophysical images to explore the plate tectonic evolution of Australia" (PDF).
- "A Custom Implementation for Visualizing Sub-surface 3D Scalar Fields in GPlates" (PDF).
- Müller, R. Dietmar; Qin, Xiaodong; Sandwell, David T.; Dutkiewicz, Adriana; Williams, Simon E.; Flament, Nicolas; Maus, Stefan; Seton, Maria (2016). "The GPlates Portal: Cloud-based interactive 3D visualization of global geophysical and geological data in a web browser". PLOS ONE. 11 (3): e0150883. Bibcode:2016PLoSO..1150883M. doi:10.1371/journal.pone.0150883. PMC 4784813. PMID 26960151.