Global Solar Atlas
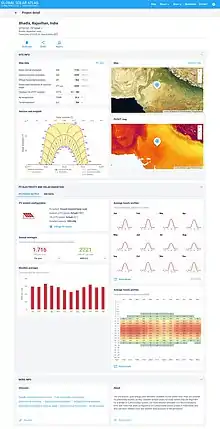
The Global Solar Atlas (GSA) is a free, online, map-based application that provides information on solar resource and photovoltaic power potential globally. It features the online interactive map tools, simplified photovoltaic (PV) power calculator, reporting tools and the extensive download section. It is intended to provide policy makers, academia, and renewable energy stakeholders to raise awareness in the solar energy domain, support the development of policies and plans, and for initial zoning and site identification purposes.
_screenshot.jpg.webp)


Background
The Global Solar Atlas is provided by the Energy Sector Management Assistance Program (ESMAP), a multi-donor trust funded program administered by the World Bank, and was developed under contract by Solargis, a provider of solar resource data and photovoltaic (PV) energy evaluation services.[1]
The GSA provides an interactive map of solar resource and photovoltaic power potential and a variety of other environmental data relevant for understanding the practical and technical potential of solar power systems at any given geographic location. For the preliminary planning of photovoltaic power plants, users can easily calculate PV energy yield for a defined photovoltaic energy system. The results are presented in the form of reports and downloadable data files. The GSA also features a rich download section, organized on the level of countries or regions. It involves the popular solar resource maps in multiple languages, country fact-sheets and spatial data in a standard GIS formats.[2]
The Global Solar Atlas was launched by the World Bank and ESMAP in January of 2017 in partnership with the International Solar Alliance.[1][3][4][5][6] An improved version of the Global Solar Atlas (GSA 2.0) was launched in October 2019, with two further updates (GSA 2.1 and GSA 2.2) since then. All data and map products within GSA are licensed under the CC BY 4.0 licence.[7]
The Global Wind Atlas is the parallel activity with comparable services for the wind power sector. The aim of the both platforms is to support the scale up of renewable energy sources in the global energy mix, as mandated under Sustainable Development Goal 7.
Methods and data
The solar resource data is supplied by the Solargis model.[8][9] The model uses data from five geostationary satellites to calculate the attenuation effect of clouds and additional variables characterising the state of the atmosphere (such as aerosols/atmospheric pollution and water vapour). The history of 10/15/30-minute time-series of solar irradiance data is aggregated into long-term yearly or monthly averages, representing the climate reference. Data is available between the parallels 60°N and 55°S in the form of gridded data (rasters) with the nominal pixel size of 250 m. It is validated through ground-based measurement campaigns where possible.[10] Several independent comparisons of solar radiation databases have been performed in recent years. Solargis has been repeatedly identified as the best performing database.[11][12][13][14]
A PV power simulator is also operated by Solargis, and it calculates the conversion of the solar resource to electric power considering also the impact of air temperature, terrain horizon, ground albedo, as well as the configuration of the pre-selected PV power systems. Besides long-term yearly averages, the PV simulator also provides long-term monthly and hourly statistics.[2]
Features
Online map-based application:[2]
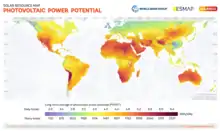
- Interactive maps allow visualisation of global solar resource data at approx 250 m grid resolution, covering global horizontal irradiation (GHI), direct normal irradiation (DNI), diffuse horizontal irradiation (DIF), and also PV power potential (PVOUT) and air temperature (TEMP) data at approx. 1 km. The data can be visualised for any location or region; numeric values are provided for each map click;
- PV yield calculator allows calculation of long-term energy yield for a set of pre-defined PV power systems. Energy yield estimates are provided as 12x24 (month x hour), profiles allowing to understand seasonal variability of PV power generation;
- Tools for a regional assessment: Calculation of the basic solar and PV power potential statistics for any country, state or custom defined region
- Visualisation and interaction with the selected data from open energy system databases
- Downloadable reports and data files
Download section:[2]
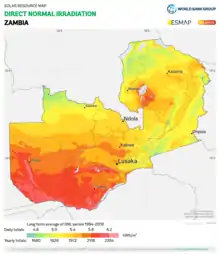
- Solar resource (GHI, DNI) and PV power potential maps in the poster-size and mid-size formats for 180+ countries and regions, useful for conceptual planning, education and visual presentation
- Gridded data in the standard GIS formats, available for further geo-spatial analysis for professional or academic tasks
- Global PV assessment and country fact-sheets[15] provide extended solar and PV power potential statistics to help policy-makers, researchers and educators understand the theoretical and practical potential of solar energy in the regions of their interest.
Usage
The Global Solar Atlas website serves over 23,000 users per month according to data from Google Analytics (June 2020). Data from GSA has been used in the number of scientific studies and R&D programmes. Only in 2019, Google Scholar noticed more than 200 individual scholarly literature, referring to GSA sources. It is regularly cited by those looking to highlight the solar resource potential globally, in a country or region,[16][17][18][19][20] or to compare the resource potential between countries.[15][21][22]
In addition, the data has or is being used by a number of other tools or studies as follows:
- ArcGIS: GIS layers from the Global Solar Atlas are available within the ArcGIS platform[23]
- Green Growth Knowledge Platform: The Global Solar Atlas is listed as a data resource[24]
- IRENA: GIS layers from the Global Solar Atlas are provided under the Global Atlas for Renewable Energy,[25] a product of the International Renewable Energy Agency (IRENA)
- Technical Rooftop Solar PV Potential in Vietnam
- RETScreen
See also
- Global Wind Atlas - the parallel initiative focused on wind energy resources
- Irradiance
- Photovoltaics
- Solar irradiance
- Solar power
References
- "New World Bank Tool Helps Map Solar Potential". World Bank. 2017-01-17. Retrieved 2020-07-22.
- ESMAP (2019). Global Solar Atlas 2.0: Technical Report (PDF). Washington, DC: World Bank.
- "World Bank, ISA's Global Solar Atlas Will Promote Worldwide Solar Development". Solar Reviews. 2017-01-18. Retrieved 2020-07-22.
- "World Bank Launches Global Solar Atlas in Partnership with International Solar Alliance". Mercom India. 2017-01-19. Retrieved 2020-07-22.
- "New atlas maps solar hot spots around the world". Energy Matters. 2017-08-03. Retrieved 2020-07-21.
- "World Bank launches online solar mapping tool". Climate Action. 2017-01-20. Retrieved 2020-07-23.
- "Terms of use". Global Solar Atlas. Retrieved 2020-07-27.
- ESMAP (2019). "Global Solar Atlas 2.0: Technical Report" (PDF). Energy Sector Management Assistance Program (ESMAP). Washington, DC: World Bank. Retrieved 2020-06-23.
- Perez, Richard; Cebecauer, Tomáš; Šúri, Marcel (2013-01-01), Kleissl, Jan (ed.), "Chapter 2 - Semi-Empirical Satellite Models", Solar Energy Forecasting and Resource Assessment, Academic Press, pp. 21–48, doi:10.1016/b978-0-12-397177-7.00002-4, ISBN 978-0-12-397177-7, retrieved 2020-06-09
- ESMAP (2019). "Global Solar Atlas 2.0: Validation Report" (PDF). Energy Sector Management Assistance Program (ESMAP). Washington, DC: World Bank. Retrieved 2020-06-23.
- Ineichen, Pierre (2013). "Long term satellite hourly, daily and monthly global, beam and diffuse irradiance validation. Interannual variability analysis". University of Geneva, International Energy Agency. p. 55. Retrieved 2020-07-23.
- Ineichen, Pierre (2014). "Satellite Irradiance Based on MACC Aerosols: Helioclim 4 and SolarGIS, Global and Beam Components Validation" (PDF). Conference Proceedings, EuroSun 2014, International Solar Energy Society. p. 10. Retrieved 2020-07-23.
- Copper, Jessie; Bruce, Anna (2018). "Comparison of Annual Global Horizontal Irradiation Maps for Australia". Asia Pacific Solar Research Conference, Sydney. p. 14. Retrieved 2020-07-23.
- Palmer, Diane; Koubli, Elena; Cole, Ian; Betts, Tom; Gottschalg, Ralph (2018-05-01). "Satellite or ground-based measurements for production of site specific hourly irradiance data: Which is most accurate and where?". Solar Energy. 165: 240–255. doi:10.1016/j.solener.2018.03.029. ISSN 0038-092X.
- ESMAP (2020). Global Photovoltaic Power Potential by Country (PDF). Washington, DC: World Bank.
- "What if We Turned The Sahara Desert Into a Giant Solar Farm?". Science Alert. 2019-05-07. Retrieved 2020-07-21.
- "Could the Sahara Turn Africa into a Solar Superpower?". Africa.com. 2020. Retrieved 2020-07-21.
- "1.35 Cents/kWh: Record Abu Dhabi Solar Bid Is A Sober Reminder To Upbeat Fossil Fuel Pundits". CleanTechnica. 2020-06-08. Retrieved 2020-07-21.
- Brent, Alan C.; Hinkley, James (Jim); Burmester, Daniel; Rayudu, Ramesh (2020-10-01). "Solar Atlas of New Zealand from satellite imagery". Journal of the Royal Society of New Zealand. 50 (4): 572–583. doi:10.1080/03036758.2020.1763409. ISSN 0303-6758. S2CID 219738127.
- Hopuare, Marania; Lucas-Svay, Lorène; Ortega, Pascal; Lucas, Franck; Laurent, Victoire (2019). Ayas, N.; Yi, C. (eds.). "Assessing solar resource and photovoltaic production in Tahiti from ground-based measurements". E3S Web of Conferences. 107: 01003. doi:10.1051/e3sconf/201910701003. ISSN 2267-1242.
- "Where are we at with solar energy?". newsroom. 2020-07-13. Retrieved 2020-07-21.
- Prăvălie, Remus; Patriche, Cristian; Bandoc, Georgeta (2019-02-01). "Spatial assessment of solar energy potential at global scale. A geographical approach". Journal of Cleaner Production. 209: 692–721. doi:10.1016/j.jclepro.2018.10.239. ISSN 0959-6526.
- "Collection of solar data layers for the assessment of solar power projects". ArcGIS. 2020-03-18. Retrieved 2020-05-07.
- "Global Solar Atlas". Green Growth Knowledge Platform. 2019-11-07. Retrieved 2020-03-24.
- "Global Atlas for Renewable Energy". IRENA. Retrieved 2020-06-25.