Information diagram

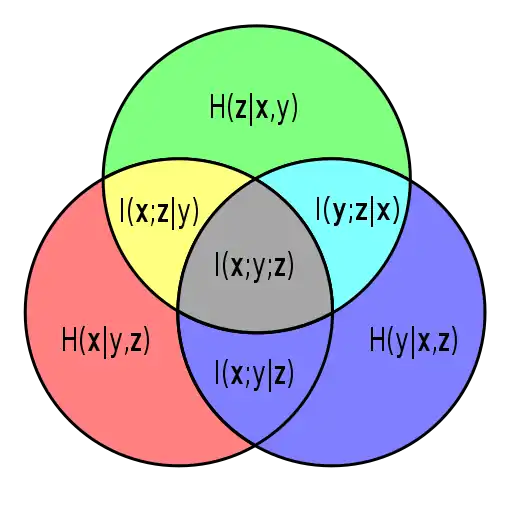
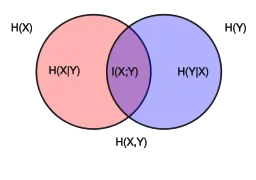
An information diagram is a type of Venn diagram used in information theory to illustrate relationships among Shannon's basic measures of information: entropy, joint entropy, conditional entropy and mutual information.[1][2] Information diagrams are a useful pedagogical tool for teaching and learning about these basic measures of information, but using such diagrams carries some non-trivial implications. For example, Shannon's entropy in the context of an information diagram must be taken as a signed measure. (See the article Information theory and measure theory for more information.). Information diagrams have also been applied to specific problems such as for displaying the information theoretic similarity between sets of ontological terms.[3]

Venn diagram of information theoretic measures for three variables x, y, and z. Each circle represents an individual entropy: H(x) is the lower left circle, H(y) the lower right, and H(z) is the upper circle. The intersections of any two circles represents the mutual information for the two associated variables (e.g. I(x;z) is yellow and gray). The union of any two circles is the joint entropy for the two associated variables (e.g. H(x,y) is everything but green). The joint entropy H(x,y,z) of all three variables is the union of all three circles. It is partitioned into 7 pieces, red, blue, and green being the conditional entropies H(x|y,z), H(y|x,z), H(z|x,y) respectively, yellow, magenta and cyan being the conditional mutual informations I(x;z|y), I(y;z|x) and I(x;y|z) respectively, and gray being the multivariate mutual information I(x;y;z). The multivariate mutual information is the only one of all that may be negative.
Venn diagram showing additive and subtractive relationships among various information measures associated with correlated variables X and Y. The area contained by both circles is the joint entropy H(X,Y). The circle on the left (red and violet) is the individual entropy H(X), with the red being the conditional entropy H(X|Y). The circle on the right (blue and violet) is H(Y), with the blue being H(Y|X). The violet is the mutual information I(X;Y).

References

  1. Fazlollah Reza. An Introduction to Information Theory. New York: McGraw-Hill 1961. New York: Dover 1994. ISBN 0-486-68210-2
  2. R. W. Yeung, A First Course in Information Theory. Norwell, MA/New York: Kluwer/Plenum, 2002.
  3. Gardeux, Vincent; Halonen, H; Jackson, D; Martinez, FD; Lussier, YA (1 Jun 2015). "Towards a PBMC "virogram assay" for precision medicine: Concordance between ex vivo and in vivo viral infection transcriptomes". Journal of Biomedical Informatics. 1: 94–103. doi:10.1016/j.jbi.2015.03.003. PMC 4951181. PMID 25797143.
This article is issued from Wikipedia. The text is licensed under Creative Commons - Attribution - Sharealike. Additional terms may apply for the media files.