Interference colour chart
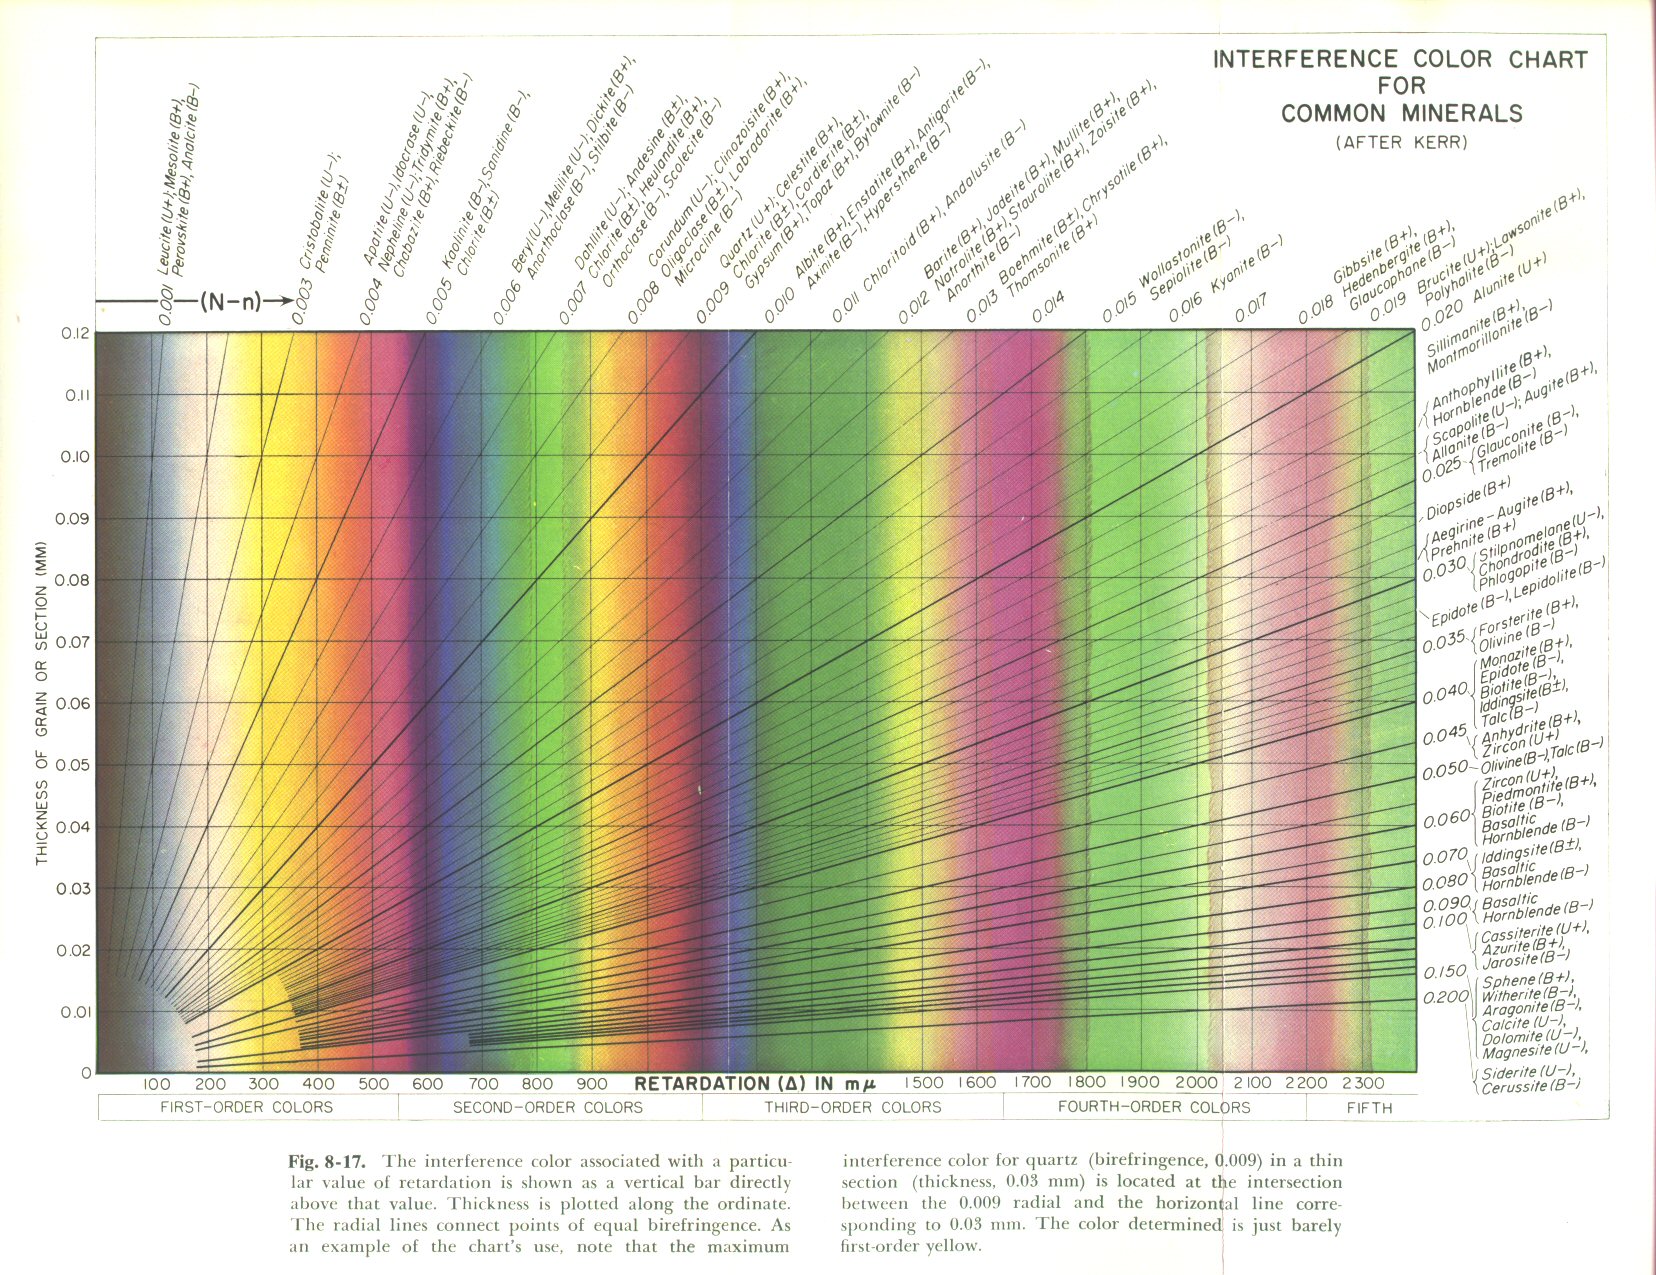
In optical mineralogy an interference colour chart, first developed by Auguste Michel-Lévy, is a tool to identify minerals in thin section using a petrographic microscope. With a known thickness of the thin section, minerals have specific and predictable colours in cross-polarized light, and this chart can help identify minerals. The colours are produced by the difference in speed in the fast and slow rays, also known as birefringence.
.jpg.webp)
Michel-Lévy interference colour chart issued by Zeiss Microscopy
When using the chart, it is important to remember these tips:
- Isotropic and opaque (metallic) minerals cannot be identified this way.
- The stage of the microscope should be rotated until maximum colour is found, and therefore, the maximum birefringence.
- Each mineral, depending on the orientation, may not exhibit the maximum birefringence. It is important to sample a number of similar minerals in order to get the best value of birefringence.
- Uniaxial minerals can look isotropic (always extinct) if the mineral is cut perpendicular to the optic axis (this situation can be revealed with the conoscopic interference pattern).
References
- Nesse, W. D., 1991, Introduction to Optical Mineralogy, 2nd edition.
This article is issued from Wikipedia. The text is licensed under Creative Commons - Attribution - Sharealike. Additional terms may apply for the media files.