iostat
iostat (input/output statistics) is a computer system monitor tool used to collect and show operating system storage input and output statistics. It is often used to identify performance issues with storage devices, including local disks, or remote disks accessed over network file systems such as NFS. It can also be used to provide information about terminal (TTY) input and output, [1] and also includes some basic CPU information.
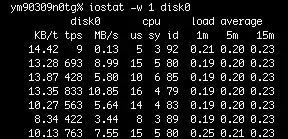
 iostat on an Apple MacBook Pro running Mac OS X, with a single hard disk | |
| Developer(s) | AT&T Bell Laboratories |
|---|---|
| Initial release | January 1979 |
| Operating system | Unix and Unix-like |
| Type | Command |
Syntax and availability
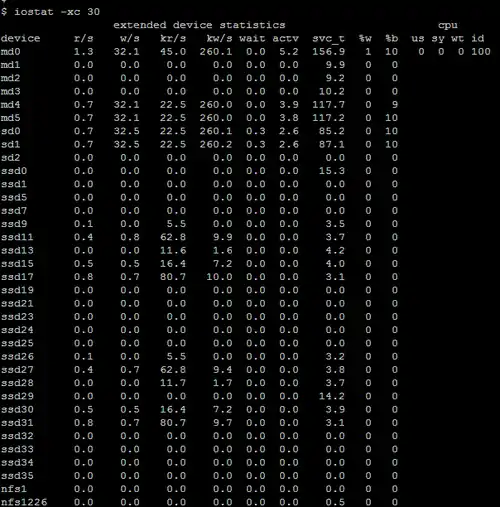
iostat -x displays output where each line (row) gives numerical data for one device. The first column lists the device name, and subsequent columns show various statistics for that device. Columns include the average service time (svc_t, which includes not only the time a request is in the service queue, but also the seek time and transfer time[2]), the average busy percentage (%b, essentially the proportion of time that the device is in use), and the percentage of time that the queue is not empty (%w, which means the proportion of time in which requests from the device have not yet been fulfilled).[1]
It is best to run iostat specifying a time interval in seconds (for example iostat -x 30) in order to see the results over time. This is because otherwise, the output will reflect the values over the entire timespan since the system was last rebooted.[2]
The iostat tool is available on most Unix and Unix-like operating systems, such as FreeBSD, macOS (com.apple.pkg.Core package), Linux (sysstat package), and Solaris. The syntax and output of iostat often differs slightly between them.[3]
Output of the command

Sun Microsystems stated that high values in the wait and svc_t fields suggest a lack of overall throughput in the system, indicating that "the system is overloaded with I/O operations". Consistently high values in the kr/s, kw/s, %w and %b fields also indicate "a possible I/O bottleneck".[1]
In versions of Solaris before Solaris 7, iostat can give misleading information in the wait field on multiprocessor systems. This is because iostat can misinterpret one processor being in a state where it is waiting for I/O, as meaning that all processors in the system are having to wait.[2]
It is also advisable to disregard high values in the svc_t field for disks that have very low rates of activity (less than 5%). This is because the fsflush process can force up the average service time when synchronising data on disk with what is in memory.[2]
iostat does not display information about the individual volumes on each disk if a volume manager is used . The vxstat command can be used to show this information instead.[1] In contrast, when using Linux LVM as a volume manager, iostat does display volume information individually, because each logical volume has its own device mapper (dm) device.
References
- Solaris System Performance Management (D.2 ed.), Sun Microsystems Enterprise Services, 2002, pp. 2–10
- Cromar, Scott (October 11, 2008), Solaris Troubleshooting Handbook, ISBN 1463512414
- Burleson, Donald K. (2002), Oracle9i UNIX administration handbook, McGraw-Hill, p. 320, ISBN 978-0072223040