Kinetic imaging
Kinetic imaging is an imaging technology developed by Szabolcs Osváth and Krisztián Szigeti in the Department of Biophysics and Radiation Biology at Semmelweis University (Budapest, Hungary). The technology allows the visualization of motion; it is based on an altered data acquisition and image processing algorithm combined with imaging techniques that use penetrating radiation (e.g., X-rays). Kinetic imaging has the potential for use in a wide variety of areas including medicine, engineering, and surveillance. For example, physiological movements, such as the circulation of blood or motion of organs can be visualized using kinetic imaging. Because of the reduced noise and the motion-based image contrast, kinetic imaging can be used to reduce X-ray dose and/or amount of required contrast agent in medical imaging (e.g., X-ray angiography).[1][2] In fact, clinical trials are underway in the fields of vascular surgery and interventional radiology.[1][2][3][4] Non-medical applications include non-destructive testing of products and port security scanning for stowaway pests.[5]
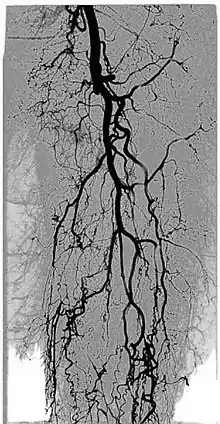
Kinetic imaging is a patented technology owned by Kinepict Ltd.[1][2][6][5]
Brief description of the kinetic imaging method
The kinetic imaging modality records a series of images generated by penetrating radiation (e.g. X-ray photons) over a period of time. Moreover, from these series of (in many cases underexposed) images, the number of detected photons can be determined for each pixel. Observed photon counts fluctuate due to different noise sources and motion within the sample.[1][2] In its simplest form, the mean, variance, error of the mean, and error of the variance of the signal intensities are calculated from the image series for each pixel and a single image then is reconstructed from each of these statistical parameters. More elaborate calculations can correct for various types of noise of known spectra, such as detector noise or photon shot noise.[1][2]
There are four types of images generated. The "variance" image is called the "kinetic" image, because it is generated by the fluctuation of attenuation caused by an object's motion, which mostly influences the value of the standard deviation; therefore, information about the motion of objects can be gained from these images.[1][2]
The "mean" image is called the "static" image, because, although it is very similar to regular projectional images, it is less affected by the noise caused by motion.[1][2]
Finally, there are two "error" images used to optimize the imaging process and facilitate further image analysis.[1][2]
Theoretical background

Projectional imaging
Although kinetic imaging has been used only with X-rays thus far, in theory, the kinetic method can be applied to any imaging technique that uses penetrating radiation, such as X-ray radiography or transmission electron microscopy. These imaging techniques are similar in that they involve reconstruction of the 2-D projectional image ("shadow image") of the studied 3-D object obtained by calculating the attenuation of the penetrating radiation along every projectional axis. The detectors measure an attenuation-related parameter specific to the type of radiation (usually transmitted photon number). Traditionally, these parameters are binned into a single image from which the attenuation values can be calculated.[2]
A distinct advantage of kinetic imaging is the ability to reduce the radiation dose, because the dose necessary for a single correctly exposed image can be distributed into several underexposed images (e.g., collect 10 images, with each 10x underexposed). Furthermore, the method can be implemented by changing the data acquisition sequence and using a new data analysis algorithm. No hardware modification is needed for most digital X-ray setups.[1][2]
Intensity fluctuations and noise
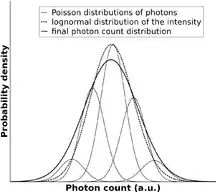
Because of the photon nature of X-rays, intensity measurements inevitably contain shot noise, which follows a Poisson distribution. Other types of noise, like detector noise or electrical noise can also contribute to fluctuations of the measured X-ray signal but do not provide information about the studied sample. In comparison, X-ray intensity changes arising from the alteration of attenuation carry important motion information. Statistical analysis of the data allows correction for the known noise sources to ascertain changes that result from movements within the sample or patient. The objective of kinetic imaging is to capture the motion information and represent it as a kinetic image.[1][2]
Calculation of attenuation values
An X-ray image results from the absorbance of X-rays as they pass through the sample. The attenuation of X-rays is calculated by the following exponential formula: .
J0 is the intensity of radiation before passing through the object of interest, J is the intensity of the attenuated radiation, "e" is Euler's constant, and D is the attenuation.
The linear attenuation coefficient along the path of the X-ray beam in the absorber is calculated as follows: .
In the above formula, μ is the attenuation coefficient and x is the distance that the radiation travelled in the absorber. To determine the attenuation D of a body experimentally, the X-ray intensities J and J0 are measured. The result of the intensity measurement can be, for example, an X-ray photon number reading, k.
The measurement only approximates expected values
The expected value (E(k), E = expected) and the variance (Var(k)) are parameters used to describe the theoretical distribution of the detected photon numbers. These parameters cannot be determined directly but they can be estimated from the measurements of intensity.[2][1]
Distribution of photon count probability
To calculate the attenuation values (E(D), Var(D), Err(E(D)) and Err(Var(D)) from the estimated photon counts (E(k),Var(k)), the distribution of the intensity probabilities should be estimated:
- If the distribution of attenuation can be estimated by a Gaussian distribution, the signal intensities (k, photon counts) follow a log-normal distribution.
- It is also assumed that the photon count values (k) are subject to Poisson distributed shot noise. In this calculation, the effect of instrument noise is ignored. However, if instrument noise contributes significantly to the measured fluctuations, the distribution of this noise must be determined and taken into account at this step.
The distribution of photon count probabilities can be used to estimate the expected value (E(D)) and the variance (Var(D)) of the attenuation:[1][2]
The error of E(D) is the standard error of experimentally calculated E(D) values and the error of Var(D) is the standard error of experimentally calculated Var(D) values. These standard error values can be estimated using theoretical models or resampling methods (bootstrapping, jackknifing).[1][2]
The outcome of these calculations
These values can be represented pixel-wise in the form of images:
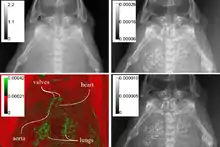
The "kinetic" image
The "kinetic" image is derived from the distribution width (e.g., variance or standard deviation) of attenuation at the pixel level. This image has a new type of contrast based on motion: static components do not appear while moving objects appear brighter if they fluctuate more or move faster.[1][2]
Difference between conventional radiographs and the "static" image
The "static" image is similar to the conventional radiographic image in most cases; however, there could be a significant difference if the studied object is moving. In this case, the "static" image is less affected by the motion noise than the ordinary calculated radiographic image. The reason is that the E(D) values are calculated by averaging the series of attenuation values computed from the corresponding series of photon numbers (from the underexposed images) and converted into a logarithm. On the other hand, the attenuation values of common radiographs are calculated from a single summed up photon number converted into a logarithm. Averaging and converting the attenuation values into logarithms are possible only if the attenuation does not vary over time. Thus, for relatively small variances, the difference is small but for large variances, the difference is significant.[1][2]
Error images
The error of the estimated statistical center (average) and width (variance) is calculated and visualized for the purpose of optimizing image acquisition parameters, decision making, computer aided detection, identification of regions of interest(ROIs), digital image processing, and image noise reduction.[1][2]
Because the error estimations are based on the measurement of physical parameters rather than a priori assumptions, these images provide a better estimation of error than other methods.[1][2]
Possible fields of application
Kinetic imaging is still under development, therefore the section contains only future objectives.
Medical uses
Digital variance angiography (DVA)
See also: Digital variance angiography
The diagnostic value of radiographic images is limited by image quality, which can be measured through signal-to-noise ratio (SNR) calculations. The higher the value of SNR, the better the image. The SNR can be increased initially by enhancing the "signal" or "contrast", which is the intensity difference between the object of interest and the background. This is usually done by adding contrast medium to increase the attenuation values of the object, while holding the background values constant.[1][2][3][4]
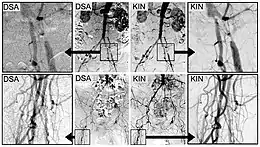
By allowing visualization of movements, kinetic imaging offers a new type of motion-based contrast. In many cases, the kinetic image will have a higher SNR (better image quality) compared to traditional images for moving objects.[2][6][1][3][4]
This improvement in SNR and image quality has been studied by Gyánó M. et al. (2018)[3] and Óriás V. et al.(2019)[4] in the field of traditional angiographic imaging and carbon-dioxide imaging. Their findings indicate that by using the kinetic imaging (or as they called this method in the case of angiographies, digital variance angiograpy, DVA) for processing angiographic image sequences, the quality improvement may increase diagnostic insight and it also creates a quality reserve, which means that DVA could provide the same level of image quality, as the gold-standard DSA technique, but the dose of administered radiation and/or contrast agent could be lowered.[3]
Functional imaging
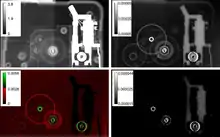
The kinetic image may allow visualisation of physiological movements, such as pulsing of the aorta, passing of a contrast agent bolus in the arteries, movement of the thoracic diaphragm, inflation and deflation of the alveoli in the lungs, or the constantly moving gastrointestinal tract.
Kinetic imaging of a living African clawed frog (Xenopus laevis) shows the end positions of the heart valves, aorta, and alveoli of the lungs.[1]
Non-destructive testing
Non-destructive testing is used to evaluate the properties of materials, components, or systems without causing damage. Kinetic imaging technology can be used directly for testing of any products that have moving parts.[1]
Port security
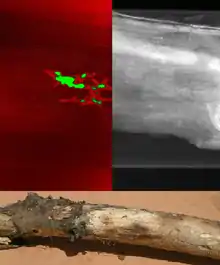
Many disastrous pest invasions started with the transport of small animals to new territories as stow-aways. Unfortunately, no known technology is capable of high throughput screening of the large volume of cargo for hidden pests. However, the addition of kinetic imaging to X-ray scanners routinely used in port security increases the ability to detect stow-away pests. This method has been used to find worms in wood and rice, and to locate mice in cargo.[1][5]
References
- Szigeti, K.; Máthé, D.; Osváth, S. (2014-10-01). "Motion Based X-Ray Imaging Modality". IEEE Transactions on Medical Imaging. 33 (10): 2031–2038. doi:10.1109/TMI.2014.2329794. ISSN 0278-0062. PMID 24951684.
- [1][2][3], Osvath, Szabolcs & Krisztián Szigeti, "New Imaging Modality Using Penetrating Radiations"
- Gyánó, Marcell; Góg, István; Óriás, Viktor I.; Ruzsa, Zoltán; Nemes, Balázs; Csobay-Novák, Csaba; Oláh, Zoltán; Nagy, Zsuzsa; Merkely, Béla; Szigeti, Krisztián; Osváth, Szabolcs (2018-10-16). "Kinetic Imaging in Lower Extremity Arteriography: Comparison to Digital Subtraction Angiography". Radiology. 290 (1): 246–253. doi:10.1148/radiol.2018172927. ISSN 0033-8419. PMID 30325284.
- Óriás, Viktor Imre; Gyánó, Marcell; Góg, István; Szöllősi, Dávid; Veres, Dániel Sándor; Nagy, Zsuzsa; Csobay-Novák, Csaba; Zoltán, Oláh; Kiss, János P.; Osváth, Szabolcs; Szigeti, Krisztián (2019-07-01). "Digital Variance Angiography as a Paradigm Shift in Carbon Dioxide Angiography". Investigative Radiology. 54 (7): 428–436. doi:10.1097/RLI.0000000000000555. ISSN 1536-0210. PMID 30829769.
- "Novel X-ray imaging technology".
- "A röntgen sugárterhelést is csökkentő szabadalom a Semmelweis Egyetem két munkatársától" (in Hungarian).