Kitchener—Waterloo (provincial electoral district)
Kitchener—Waterloo was a provincial electoral district in Ontario, Canada, that was represented in the Legislative Assembly of Ontario from 1999 to 2018. Its population in 2006 was 126,742. The riding was created in 1996 from parts of Waterloo North, Kitchener—Wilmot and Kitchener.
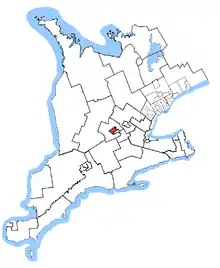 Kitchener—Waterloo in relation to southern Ontario ridings | |
| Defunct provincial electoral district | |
| Legislature | Legislative Assembly of Ontario |
| District created | 1996 |
| District abolished | 2015 |
| First contested | 1999 |
| Last contested | 2014 |
| Demographics | |
| Population (2006) | 126,742 |
| Electors (2007) | 92,313 |
| Area (km²) | 91 |
| Census division(s) | Waterloo |
| Census subdivision(s) | Waterloo, Kitchener |
Geography
The district consists of the City of Waterloo and the northern part of the City of Kitchener.
The electoral district was created as part of the 1996 redistribution of provincial ridings to have the same borders as federal ridings, and first contested in 1999 general election.
It consisted initially of the City of Waterloo and the part of the City of Kitchener lying north of a line drawn from west to east along Highland Road West, Lawrence Avenue and Victoria Street.
In 2003, the Kitchener part of the riding was redefined to be the part of the city lying north of a line drawn from west to east along Highland Road West, Fischer Hallman Road and the Canadian National Railway situated north of Shadeland Crescent.
For the 2018 general election, the riding was dissolved into Waterloo, Kitchener Centre, and Kitchener—Conestoga.
Member of Provincial Parliament
This riding has elected the following members of the Legislative Assembly of Ontario:
| Kitchener—Waterloo | ||||
|---|---|---|---|---|
| Assembly | Years | Member | Party | |
| Riding created from Waterloo North, Kitchener—Wilmot and Kitchener |
||||
| 37th | 1999–2003 | Elizabeth Witmer | Progressive Conservative | |
| 38th | 2003–2007 | |||
| 39th | 2007–2011 | |||
| 40th | 2011–2012 | |||
| 2012–2014 | Catherine Fife | New Democratic | ||
| 41st | 2014–2018 | |||
| Riding dissolved into Waterloo, Kitchener Centre, and Kitchener—Conestoga |
||||
Election results
| 2014 Ontario general election | ||||||||
|---|---|---|---|---|---|---|---|---|
| Party | Candidate | Votes | % | ±% | ||||
| New Democratic | Catherine Fife | 20,536 | 37.43 | -2.44 | ||||
| Liberal | Jamie Burton | 16,534 | 30.14 | +6.15 | ||||
| Progressive Conservative | Tracey Weiler | 14,450 | 26.34 | -5.49 | ||||
| Green | Stacey Danckert | 2,859 | 5.21 | +1.94 | ||||
| Libertarian | James Schulz | 438 | 0.78 | +0.49 | ||||
| Freedom | Nicholas Roy | 43 | 0.07 | +0.05 | ||||
| Total valid votes | 54,860 | 100.00 | ||||||
| Total rejected, unmarked and declined ballots | 623 | 1.12 | ||||||
| Turnout | 55,483 | 54.95 | ||||||
| Eligible voters | 100,972 | |||||||
| New Democratic hold | Swing | -4.29 | ||||||
Source(s)
Elections Ontario (2014). "Official Returns from the Records, 039 Kitchener—Waterloo" (PDF). Retrieved 23 August 2015. | ||||||||
| Ontario provincial by-election, September 6, 2012 Resignation of Elizabeth Witmer | ||||||||
|---|---|---|---|---|---|---|---|---|
| Party | Candidate | Votes | % | ±% | ||||
| New Democratic | Catherine Fife | 18,599 | 39.87 | +23.20 | ||||
| Progressive Conservative | Tracey Weiler | 14,851 | 31.83 | -11.94 | ||||
| Liberal | Eric Davis | 11,194 | 23.99 | -12.05 | ||||
| Green | Stacey Danckert | 1,525 | 3.27 | +0.63 | ||||
| Libertarian | Allan Dettweiler | 156 | 0.33 | |||||
| Freedom | David Driver | 95 | 0.20 | -0.05 | ||||
| Communist | Elizabeth Rowley | 85 | 0.18 | |||||
| Independent | Garnet Bruce | 77 | 0.17 | |||||
| People's Political Party | Kevin Clarke | 48 | 0.10 | |||||
| Pauper | John Turmel | 23 | 0.05 | |||||
| Total valid votes | 46,653 | 100.00 | ||||||
| Total rejected, unmarked and declined ballots | 128 | 0.27 | ||||||
| Turnout | 46,781 | 47.00 | ||||||
| Eligible voters | 99,544 | |||||||
| New Democratic gain from Progressive Conservative | Swing | +17.57 | ||||||
Source(s)
Elections Ontario (2012). "Official return from the records / Rapport des registres officiels - Kitchener—Waterloo by-election" (PDF). Retrieved 2 June 2014. | ||||||||
| 2011 Ontario general election | ||||||||
|---|---|---|---|---|---|---|---|---|
| Party | Candidate | Votes | % | ±% | ||||
| Progressive Conservative | Elizabeth Witmer | 21,665 | 43.77 | +2.93 | ||||
| Liberal | Eric Davis | 17,837 | 36.04 | +4.84 | ||||
| New Democratic | Isabel Cisterna | 8,250 | 16.67 | -0.85 | ||||
| Green | J. D. McGuire | 1,308 | 2.64 | -6.63 | ||||
| Independent | Peter Davis | 316 | 0.64 | |||||
| Freedom | Melanie Motz | 123 | 0.25 | |||||
| Total valid votes | 49,499 | 100.00 | ||||||
| Total rejected, unmarked and declined ballots | 168 | 0.34 | ||||||
| Turnout | 49,667 | 50.54 | -3.09 | |||||
| Eligible voters | 98,268 | |||||||
| Progressive Conservative hold | Swing | -0.96 | ||||||
| Source: Elections Ontario[1] | ||||||||
| 2007 Ontario general election | ||||||||
|---|---|---|---|---|---|---|---|---|
| Party | Candidate | Votes | % | ±% | ||||
| Progressive Conservative | Elizabeth Witmer | 20,748 | 40.84 | -2.24 | ||||
| Liberal | Louise Ervin | 15,848 | 31.20 | -9.18 | ||||
| New Democratic | Catherine Fife | 8,902 | 17.52 | +6.58 | ||||
| Green | Judy Greenwood-Speers | 4,707 | 9.27 | +6.08 | ||||
| Family Coalition | Louis Reitzel | 598 | 1.18 | -0.53 | ||||
| Total valid votes | 50,803 | 100.00 | ||||||
| Total rejected ballots | 313 | |||||||
| Turnout | 51,116 | 53.63 | ||||||
| Eligible voters | 95,319 | |||||||
| 2003 Ontario general election | ||||||||
|---|---|---|---|---|---|---|---|---|
| Party | Candidate | Votes | % | ±% | ||||
| Progressive Conservative | Elizabeth Witmer | 23,957 | 43.08 | -11.28 | ||||
| Liberal | Sean Strickland | 22,456 | 40.38 | +5.16 | ||||
| New Democratic | Dan Lajoie | 6,084 | 10.94 | +4.84 | ||||
| Green | Pauline Richards | 1,774 | 3.19 | +1.56 | ||||
| Family Coalition | Lou Reitzel | 949 | 1.71 | -0.08 | ||||
| Independent | Owen Alastair Ferguson | 242 | 0.44 | |||||
| Independent | Julian Ichim | 153 | 0.28 | |||||
| Total valid votes | 55,615 | 100.00 | ||||||
| 1999 Ontario general election | ||||||||
|---|---|---|---|---|---|---|---|---|
| Party | Candidate | Votes | % | |||||
| Progressive Conservative | Elizabeth Witmer | 27,830 | 54.36 | |||||
| Liberal | Sean Strickland | 18,034 | 35.22 | |||||
| New Democratic | Ted Martin | 3,122 | 6.10 | |||||
| Family Coalition | Lou Reitzel | 919 | 1.79 | |||||
| Green | Judy Greenwood-Speers | 836 | 1.63 | |||||
| Independent | Matthew Albrecht | 202 | 0.39 | |||||
| Natural Law | Richard Beecroft | 135 | 0.26 | |||||
| Independent | Helmut Braun | 122 | 0.24 | |||||
| Total valid votes | 51,200 | 100.00 | ||||||
2007 electoral reform referendum
| 2007 Ontario electoral reform referendum | |||
|---|---|---|---|
| Side | Votes | % | |
| First Past the Post | 28,641 | 57.1 | |
| Mixed member proportional | 21,516 | 42.9 | |
| Total valid votes | 50,157 | 100.0 | |
Notes
- Elections Ontario (2011). "Official return from the records / Rapport des registres officiels - Kitchener—Waterloo" (PDF). Retrieved 2 June 2014.