Lieberose
Lieberose (Lower Sorbian: Luboraz) is a town in the Dahme-Spreewald district, in Brandenburg, Germany. It is situated 25 km north of Cottbus.
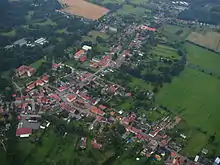
Lieberose, Aerial view
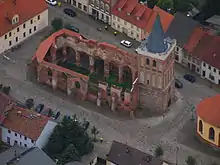
Lieberose, Church
Lieberose | |
|---|---|
 Coat of arms | |
Location of Lieberose within Dahme-Spreewald district 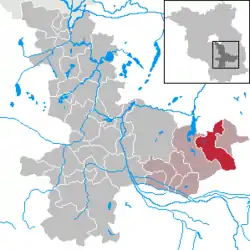 | |
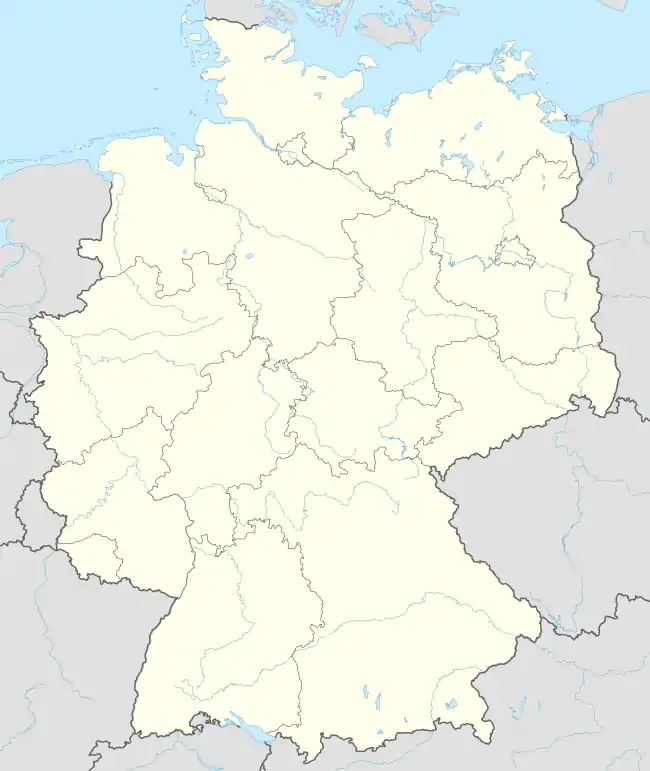 Lieberose 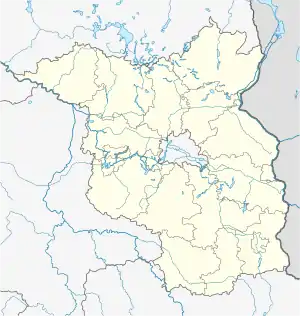 Lieberose | |
| Coordinates: 51°58′59″N 14°18′00″E | |
| Country | Germany |
| State | Brandenburg |
| District | Dahme-Spreewald |
| Municipal assoc. | Lieberose/Oberspreewald |
| Subdivisions | 5 Ortsteile |
| Government | |
| • Mayor | Petra Dreißig |
| Area | |
| • Total | 72.51 km2 (28.00 sq mi) |
| Elevation | 50 m (160 ft) |
| Population (2019-12-31)[1] | |
| • Total | 1,368 |
| • Density | 19/km2 (49/sq mi) |
| Time zone | UTC+01:00 (CET) |
| • Summer (DST) | UTC+02:00 (CEST) |
| Postal codes | 15868 |
| Dialling codes | 033671 |
| Vehicle registration | LDS |
| Website | www.amt-lieberose-oberspreewald.de |
History
During World War II, Lieberose forced labor camp, a subcamp of Sachsenhausen concentration camp was located here.[2] (The subcamp, KL Lieberose, was a labour camp for the support point of SS- Division "Kurmark". The SS- Division "Kurmark" located in Lieberose and surrounding area.
Near the end of the war, Jewish prisoners were sent on a death march towards Sachsenhausen.[3]
After World War II was the camp a prison camp for the soviet secret service (NKGB).
Demography
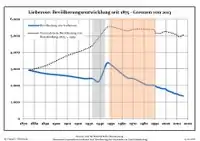
Development of population since 1875 within the current boundaries (Blue line: Population; Dotted line: Comparison to population development of Brandenburg state; Grey background: Time of Nazi rule; Red background: Time of communist rule)
|
|
|
See also
References
- "Bevölkerung im Land Brandenburg nach amtsfreien Gemeinden, Ämtern und Gemeinden 31. Dezember 2019". Amt für Statistik Berlin-Brandenburg (in German). July 2020.
- "The List of the Camps". jewishgen.org. Retrieved 2016-09-16.
- Gilbert, Martin (2002). The Routledge Atlas of the Holocaust. Routledge. p. 212. ISBN 9780415281454.
- Detailed data sources are to be found in the Wikimedia Commons.Population Projection Brandenburg at Wikimedia Commons
External links
- (in German) Official site
 Media related to Lieberose at Wikimedia Commons
| Authority control |
|---|
This article is issued from Wikipedia. The text is licensed under Creative Commons - Attribution - Sharealike. Additional terms may apply for the media files.