Manhattan plot
A Manhattan plot is a type of scatter plot, usually used to display data with a large number of data-points, many of non-zero amplitude, and with a distribution of higher-magnitude values. The plot is commonly used in genome-wide association studies (GWAS) to display significant SNPs.[1]
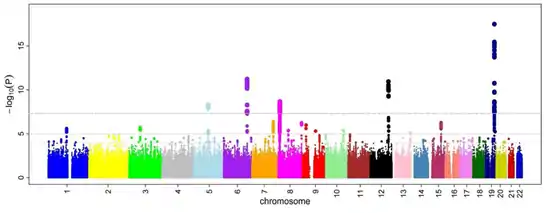
It gains its name from the similarity of such a plot to the Manhattan skyline: a profile of skyscrapers towering above the lower level "buildings" which vary around a lower height.
GWAS
In GWAS Manhattan plots, genomic coordinates are displayed along the X-axis, with the negative logarithm of the association p-value for each single nucleotide polymorphism (SNP) displayed on the Y-axis, meaning that each dot on the Manhattan plot signifies a SNP. Because the strongest associations have the smallest p-values (e.g., 10−15), their negative logarithms will be the greatest (e.g., 15). The different colors of each block usually shows the extent of each chromosome.
References
- Gibson, Greg (2010). "Hints of hidden heritability in GWAS". Nature Genetics. 42 (7): 558–560. doi:10.1038/ng0710-558. PMID 20581876.
| Wikimedia Commons has media related to Manhattan plot. |