Polar curve (aerodynamics)
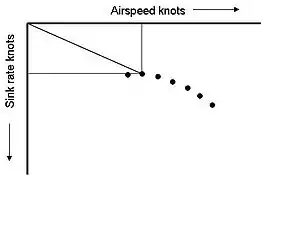
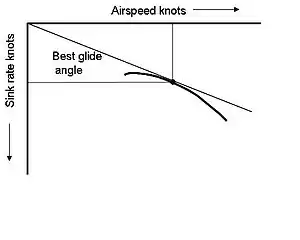
A polar curve is a graph which contrasts the sink rate of an aircraft (typically a glider) with its horizontal speed. A polar curve is a graph with the glider's sink rate, plotted on a vertical axis, at a given airspeed, plotted on a horizontal axis. Polar curves are used to compute the glider's minimum sink speed, best lift over drag (L/D), and speed to fly.[1][2]


Plotting the curve
The polar curve of a glider is derived from theoretical calculations, or by measuring the rate of sink at various airspeeds. These data points are then connected by a line to form the curve. Each type of glider has a unique polar curve, and individual gliders vary somewhat depending on the smoothness of the wing, control surface drag, or the presence of bugs, dirt, and rain on the wing. Different glider configurations will have different polar curves, for example, solo versus dual flight, with and without water ballast, different flap settings, or with and without wing-tip extensions.[2]
Knowing the best speed to fly is important in exploiting the performance of a glider. Two of the key measures of a glider’s performance are its minimum sink rate and its best glide ratio, also known as the best "glide angle". These occur at different speeds. Knowing these speeds is important for efficient cross-country flying. In still air the polar curve shows that flying at the minimum sink speed enables the pilot to stay airborne for as long as possible and to climb as quickly as possible, but at this speed the glider will not travel as far as if it flew at the speed for the best glide.
Effect of wind, lift and sink on best glide speed
The best speed to fly in a head wind is determined from the graph by shifting the origin to the right along the horizontal axis by the speed of the headwind, and drawing a new tangent line. This new airspeed will be faster as the headwind increases, but will result in the greatest distance covered. A general rule of thumb is to add half the headwind component to the best L/D for the maximum distance. For a tailwind, the origin is shifted to the left by the speed of the tailwind, and drawing a new tangent line. The tailwind speed to fly will lie between minimum sink and best L/D.[2]
In subsiding air, the polar curve is shifted lower according the airmass sink rate, and a new tangent line drawn. This will show the need to fly faster in subsiding air, which gives the subsiding air less time to lower the glider's altitude. Correspondingly, the polar curve is displaced upwards according to the lift rate, and a new tangent line drawn.[1]
External links
- Glider Performance Airspeeds An animated explanation of the basic polar curve, with modifications for sinking or rising air and for head- or tailwinds.
References
- Wander, Bob (2003). Glider Polars and Speed-To-Fly...Made Easy!. Minneapolis: Bob Wander's Soaring Books & Supplies. p. 7-10.
- Glider Flying Handbook, FAA-H-8083-13. U.S. Department of Transportation, FAA. 2003. p. 5-6 to 5-9. ISBN 9780160514197.
Additional Reading
- Reichmann, Helmut (2005). Streckensegelflug. Motorbuch Verlag. ISBN 3-613-02479-9.