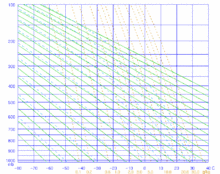
Stüve diagram
A Stüve diagram is one of four thermodynamic diagrams commonly used in weather analysis and forecasting. It was developed circa 1927 by the German meteorologist Georg Stüve (1888–1935) and quickly gained widespread acceptance in the United States to plot temperature and dew point data from radiosondes.

This diagram has a simplicity in that it uses straight lines for the three primary variables: pressure, temperature and potential temperature. The isotherms are straight and vertical, isobars are straight and horizontal and dry adiabats are also straight and have a 45 degree inclination to the left while moist adiabats are curved. Wind barbs are often plotted at the side of the diagram to indicate the winds at different heights they are used to save space with symbols to help in charts.
However, using this configuration sacrifices the equal-area property of the original Clausius–Clapeyron relation requirements between the temperature of the environment and the temperature of a parcel of air lifted/lowered. Although it permits to analyze the cloud cover and the stability of the airmass, it thus does not permit to calculate the Convective Available Potential Energy (CAPE). This is why the three other thermodynamic diagrams (emagrams, tephigrams, and skew-T log-P diagrams) are most often preferred, the latter in the USA nowadays.
References
- M. K. Yau and R. R. Rogers, Short Course in Cloud Physics, Third Edition, published by Butterworth-Heinemann, January 1, 1989, 304 pages. ISBN 9780750632157 ISBN 0-7506-3215-1
- J. V. Iribarne and W. L. Godson, Atmospheric Thermodynamics, Second Edition, published by D. Reidel Publishing Company, Dordrecht, Holland, 1981, 278 pages, ISBN 90-277-1297-2, ISBN 978-90-277-1297-4