Study of animal locomotion
The study of animal locomotion is a branch of biology that investigates and quantifies how animals move.
Kinematics
Kinematics is the study of how objects move, whether they are mechanical or living. In animal locomotion, kinematics is used to describe the motion of the body and limbs of an animal. The goal is ultimately to understand how the movement of individual limbs relates to the overall movement of an animal within its environment. Below highlights the key kinematic parameters used to quantify body and limb movement for different modes of animal locomotion.
Quantifying locomotion
Walking
Legged locomotion is a dominant form of terrestrial locomotion, the movement on land. The motion of limbs is quantified by intralimb and interlimb kinematic parameters.[1][2] Intralimb kinematic parameters capture movement aspects of an individual limb, whereas, interlimb kinematic parameters characterize the coordination across limbs. Interlimb kinematic parameters are also referred to as gait parameters. The following are key intralimb and interlimb kinematic parameters of walking:[3][1][2][4][5]
Intralimb kinematic parameters:
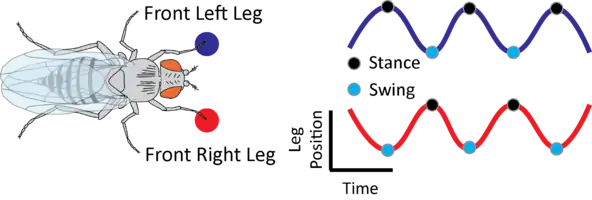
Anterior Extreme Position (AEP): position of the leg when it first contacts the ground (i.e. start of stance phase).
Posterior Extreme Position (PEP): position of the leg when it first lifts off of the ground (i.e. start of swing phase).
Stride duration: elapsed time between two onsets of stance.
Stride frequency: inverse of stride duration. The number of strides within a second.
Stance duration: time elapsed between stance onset (i.e. AEP) and swing onset (i.e. PEP).
Swing duration: time elapsed between swing onset (i.e. PEP) and the subsequent stance onset (i.e. AEP).
Stride length: the distance a leg travels between stance onset (i.e. AEP) and swing onset (i.e. PEP).
Stride amplitude: the distance a leg travels between swing onset (i.e. PEP) and the subsequent stance onset (i.e. AEP), while also accounting for the movement of the body.
Interlimb kinematic parameters:
Step length: the distance from the stance onset of a reference leg to its contralateral counterpart.
Phase: the lag of a leg relative to the stride period of a reference leg.
Number of legs in stance: The number of legs in stance at a single point in time.
Tripod coordination strength (TCS): specific to hexapod interlimb coordination, this parameter determines how much the interlimb coordination resembles the canonical tripod gait. TCS is calculated as the ratio of the total time legs belonging to a tripod (i.e. left front, middle right, and hind left legs, or vice versa) are in swing together, by the time elapsed between the first leg of the tripod that enters swing and the last leg of the same tripod that exits swing.
Characterizing swing and stance transitions [2][3][4][5]:
The calculation of the above intra- and interlimb kinematics relies on the classification of when the legs of an animal touches and leaves the ground. Stance onset is defined as when a leg first contacts the ground, whereas, swing onset occurs at the time when the leg leaves the ground. Typically, the transition between swing and stance, and vice versa, of a leg is determined by first recording the leg's motion with high-speed videography (see the description of high-speed videography below for more details). From the video recordings of the leg, a marker on the leg (usually placed at the distal tip of the leg) is then tracked manually or in an automated fashion to obtain the position signal of the leg's movement. The position signal associated with each leg is then normalized to that associated with a marker on the body; transforming the leg position signal into body-centered coordinates. This normalization is necessary to isolate the movement of the leg relative to that of the body. For tracking the leg movement of unconstrained/untethered animals, it is important to perform a coordinate transform so that the movement of the animal is aligned along one axis (e.g. a common heading angle). This is also a necessary step because it isolates the oscillatory anterior-posterior movement of the leg along a single axis, rather than being obscured across multiple axes. Once the tracked and normalized leg position is obtained, one way to determine the onsets of stance and swing are to find the peaks and troughs of the leg position signal. The peaks of the leg position signal are the stance onsets, which are also the anterior extreme positions of the leg for each step. On the other hand, the troughs of the leg position signal are the swing onsets as well as the posterior extreme positions of the leg for each step. Therefore, the transitions between stance and swing, and vice versa, are determined by finding the peaks and the troughs of the normalized leg position signal. Alternatively, these transitions can be found by using leg velocity, the derivative of the leg position signal. When using this approach, a threshold is chosen to categorize leg movement into stance and swing given the instantaneous velocity of the leg. This stance and swing classification approach is useful for instances when the interaction between the leg and substrate is unclear (i.e. difficult to tell when the leg truly contacts the substrate). Regardless of the approach, accurately classifying swing and stance is crucial for the above calculations of intra- and interlimb kinematic parameters.
Joint angle analyses:
Walking can also be quantified through the analysis of joint angles.[6][7][8] During legged locomotion, an animal flexes and extends its joints in an oscillatory manner, creating a joint angle pattern that repeats across steps. The following are some useful joint angle analyses for characterizing walking:
Joint angle trace: a trace of the angles that a joint exhibits during walking.
Joint angle distribution: the distribution of angles of a joint.
Joint angle extremes: the maximum (extension) and minimum (flexion) angle of a joint during walking.
Joint angle variability across steps: the variability between joint angle traces of several steps.
Relationship between several joint angles: the relative angles of two joints, either from the same leg or between legs. For example, the angle of a human's left femur-tibia (knee) joint when the right femur-tibia joint is at its most flexed or extended angle.
Flight
Aerial locomotion is a form of movement used by many organisms and is typically powered by at least one pair of wings. Some organisms, however, have other morphological features that allow them to glide. There are many different flight modes, such as takeoff, hovering, soaring, and landing.[9] Quantifying wing movements during these flight modes will provide insight about the body and wing maneuvers that are required to execute these behaviors.[9] Wing orientation is quantified throughout the flight cycle by three angles that are defined in a coordinate system relative to the base of the wing.[10][11] The magnitude of these three angles are often compared for upstrokes and downstrokes.[10][11][12][13] In addition, kinematic parameters are used to characterize the flight cycle, which consists of an upstroke and a downstroke.[10][12][13][11] Aerodynamics are often considered when quantifying aerial locomotion, as aerodynamic forces (e.g. lift or drag) are able to influence flight performance.[14] Key parameters from these three categories are defined as follows:
Angles to quantify wing orientation:
Wing orientation is described in the coordinate system centered at the wing hinge.[10] The x-y plane coincides with the stroke plane, the plane parallel to the plane that contains both wing tips and is centered at the wing base.[10] Assuming the wing can modeled by the vector passing through the wing base and wing tip, the following angles describe the orientation of the wing:[10]
Stroke position: angle describing the anterior-to-posterior motion of the wings relative to the stroke plane. This angle is computed as the projection of the wing vector onto the stroke plane.
Stroke deviation: angle describing the vertical amplitude of the wings relative to the stroke plane. This angle is defined as the angle between the wing vector and its projection onto the stroke plane.
Angle of attack: angular orientation of the wings (i.e. tilt) relative to the stroke plane. This angle is computed as the angle between the wing cross section vector and the stroke plane.
Kinematic parameters:
Upstroke amplitude: angular distance through which the wings travel during an upstroke.
Downstroke amplitude: angular distance through which the wings travel during a downstroke.
Stroke duration: time elapsed between the onset of two consecutive upstrokes.
Wingbeat frequency: inverse of stroke duration. The number of wingbeats per second.
Flight distance per wingbeat: the distance covered during each wingbeat.
Upstroke duration: time elapsed between the onset of an upstroke and the onset of a downstroke.
Downstroke duration: time elapsed between the onset of a downstroke and the onset of an upstroke.
Phase: if an organism has both front and hind wings, the lag of a wing pair relative to the other (reference) wing pair.
Aerodynamic parameters:
Reynolds number: ratio of inertial forces to viscous forces. This metric helps describe how wing performance changes with body size.[14]
Methods of study
A variety of methods and equipment are used to study animal locomotion:
Treadmills are used to allow animals to walk or run while remaining stationary or confined with respect to external observers. This technique facilitates filming or recordings of physiological information from the animal (e.g., during studies of energetics[15]). Motorized treadmills are also used to measure the endurance capacity (stamina) of animals.[16][17]
Racetracks lined with photocells or filmed while animals run along them are used to measure acceleration and maximal sprint speed.[18][19]
High-speed videography for the study of the motion of an entire animal or parts of its body (i.e. Kinematics) is typically accomplished by tracking anatomical locations on the animal and then recording video of its movement from multiple angles. Traditionally, anatomical locations have been tracked using visual markers that have been placed on the animal’s body. However, it is becoming increasingly more common to use computer vision techniques to achieve markerless pose estimation. These two methods are discussed in more detail below.
Marker-based pose estimation: Visual markers must be placed on an animal at the desired regions of interest. The location of each marker is determined for each video frame, and data from multiple views is integrated to give positions of each point through time. The visual markers can then be annotated in each frame manually. However, this is a time-consuming task, so computer vision techniques are often used to automate the detection of the markers.
Markerless pose estimation: User-defined body parts must be manually annotated in a series of frames to use as training data.[20] Deep learning and computer vision techniques are then employed to learn the location of the body parts in the training data. Next, the trained model is used to predict the location of the body parts in each frame on newly collected videos. The resulting time series data consists of the positions of the visible body parts at each frame in the video. Model parameters can be optimized to minimize tracking error and increase robustness.
The kinematic data obtained from either of these methods can be used to determine fundamental motion attributes such as velocity, acceleration, joint angles, and the sequencing and timing of kinematic events. These fundamental attributes can be used to quantify various higher level attributes, such as the physical abilities of the animal (e.g., its maximum running speed, how steep a slope it can climb), gait, neural control of locomotion, and responses to environmental variation. These can aid in formulation of hypotheses about the animal or locomotion in general.
Marker-based and markerless pose estimation approaches have advantages and disadvantages, so the method that is best suited for collecting kinematic data may be largely dependent on the animal of study. Marker-based tracking methods tend to be more portable than markerless methods, which require precise camera calibration.[21] Markerless approaches, however, overcome several weaknesses of marker-based tracking, since placing visual markers on the animal of study may be impractical, expensive, or time consuming.[21] There are many publicly accessible software packages that provide support for markerless pose estimation.[20]
Force plates are platforms, usually part of a trackway, that can be used to measure the magnitude and direction of forces of an animal's step. When used with kinematics and a sufficiently detailed model of anatomy, inverse dynamics solutions can determine the forces not just at the contact with the ground, but at each joint in the limb.
Electromyography (EMG) is a method of detecting the electrical activity that occurs when muscles are activated, thus determining which muscles an animal uses for a given movement. This can be accomplished either by surface electrodes (usually in large animals) or implanted electrodes (often wires thinner than a human hair). Furthermore, the intensity of electrical activity can correlate to the level of muscle activity, with greater activity implying (though not definitively showing) greater force.
Optogenetics is a method used to control the activity of targeted neurons that have been genetically modified to respond to light signals. Optogenetic activation and silencing of neurons can help determine which neurons are required to carry out certain locomotor behaviors, as well as the function of these neurons in the execution of the behavior.
Sonomicrometry employs a pair of piezoelectric crystals implanted in a muscle or tendon to continuously measure the length of a muscle or tendon. This is useful because surface kinematics may be inaccurate due to skin movement. Similarly, if an elastic tendon is in series with the muscle, the muscle length may not be accurately reflected by the joint angle.
Tendon force buckles measure the force produced by a single muscle by measuring the strain of a tendon. After the experiment, the tendon's elastic modulus is determined and used to compute the exact force produced by the muscle. However, this can only be used on muscles with long tendons.
Particle image velocimetry is used in aquatic and aerial systems to measure the flow of fluid around and past a moving aquatic organism, allowing fluid dynamics calculations to determine pressure gradients, speeds, etc.
Fluoroscopy allows real-time X-ray video, for precise kinematics of moving bones. Markers opaque to X-rays can allow simultaneous tracking of muscle length.
Many of the above methods can be combined to enhance the study of locomotion. For example, studies frequently combine EMG and kinematics to determine motor pattern, the series of electrical and kinematic events that produce a given movement. Optogenetic perturbations are also frequently combined with kinematics to study how locomotor behaviors and tasks are affected by the activity of a certain group of neurons. Observations resulting from optogenetic experiments may provide insight into the neural circuitry that underlies different locomotor behaviors. It is also common for studies to collect high-speed videos of animals on a treadmill. Such a setup may allow for increased accuracy and robustness when determining an animal's poses across time.
References
- Darmohray, Dana M.; Jacobs, Jovin R.; Marques, Hugo G.; Carey, Megan R. (2019-04-03). "Spatial and Temporal Locomotor Learning in Mouse Cerebellum". Neuron. 102 (1): 217–231.e4. doi:10.1016/j.neuron.2019.01.038. ISSN 0896-6273. PMID 30795901.
- DeAngelis, Brian D.; Zavatone-Veth, Jacob A.; Clark, Damon A (2019-06-28). Calabrese, Ronald L. (ed.). "The manifold structure of limb coordination in walking Drosophila". eLife. 8: e46409. doi:10.7554/eLife.46409. ISSN 2050-084X. PMC 6598772. PMID 31250807.
- Mendes, César S.; Bartos, Imre; Akay, Turgay; Márka, Szabolcs; Mann, Richard S. (2013-01-08). Calabrese, Ron (ed.). "Quantification of gait parameters in freely walking wild type and sensory deprived Drosophila melanogaster". eLife. 2: e00231. doi:10.7554/eLife.00231. ISSN 2050-084X. PMC 3545443. PMID 23326642.
- Pfeffer, Sarah Elisabeth; Wahl, Verena Luisa; Wittlinger, Matthias; Wolf, Harald (2019-10-15). "High-speed locomotion in the Saharan silver ant, Cataglyphis bombycina". Journal of Experimental Biology. 222 (20): jeb198705. doi:10.1242/jeb.198705. ISSN 0022-0949. PMID 31619540.
- Wosnitza, Anne; Bockemühl, Till; Dübbert, Michael; Scholz, Henrike; Büschges, Ansgar (2013-02-01). "Inter-leg coordination in the control of walking speed in Drosophila". Journal of Experimental Biology. 216 (3): 480–491. doi:10.1242/jeb.078139. ISSN 0022-0949. PMID 23038731.
- Jin, Li; Hahn, Michael E. (2019-04-03). "Comparison of lower extremity joint mechanics between healthy active young and middle age people in walking and running gait". Scientific Reports. 9 (1): 5568. doi:10.1038/s41598-019-41750-9. ISSN 2045-2322.
- Cruse, H.; Bartling, Ch. (1995-09-01). "Movement of joint angles in the legs of a walking insect, Carausius morosus". Journal of Insect Physiology. 41 (9): 761–771. doi:10.1016/0022-1910(95)00032-P. ISSN 0022-1910.
- Tsang, Dorothea J.; Lukac, Meghan; Martin, Anne E. (2019-12-01). "Characterization of statistical persistence in joint angle variation during walking". Human Movement Science. 68: 102528. doi:10.1016/j.humov.2019.102528. ISSN 0167-9457.
- Berg Angela, M.; Biewener, Andrew A. (2010). "Wing and body kinematics of takeoff and landing flight in the pigeon (Columba livia)". Journal of Experimental Biology. 213 (10): 1651–1658. doi:10.1242/jeb.038109. PMID 20435815.CS1 maint: uses authors parameter (link)
- Cheng, X; Sun, M. (2016). "Wing-kinematics measurement and aerodynamics in a small insect in hovering flight". Scientific Reports. 6: 25706. Bibcode:2016NatSR...625706C. doi:10.1038/srep25706. PMC 4863373. PMID 27168523.CS1 maint: uses authors parameter (link)
- Fry, S. N.; Sayaman R; Dickinson, M. H. (2005). "The aerodynamics of hovering flight in Drosophila". Journal of Experimental Biology. 208 (12): 2303–2318. doi:10.1242/jeb.01612. PMID 15939772.CS1 maint: uses authors parameter (link)
- Ruppel, G. (1989). "Kinematic Analysis of Symmetrical Flight Manoeuvers of Odanata" (PDF). Journal of Experimental Biology. 144: 13–42.
- Fontaine, E. I.; Zabala, F.; Dickinson M. H.; Burdick, J. W. (2009). "Wing and body motion during flight initiation in Drosophila revealed by automated visual tracking". Journal of Experimental Biology. 212 (9): 1307–23. doi:10.1242/jeb.025379. PMID 19376952.CS1 maint: uses authors parameter (link)
- Birch, J. M.; Dickson, W. B.; Dickinson, M. H. (2004). "Force production and flow structure of the leading edge vortex on flapping wings at high and low Reynolds numbers". Journal of Experimental Biology. 207 (7): 1063–1072. doi:10.1242/jeb.00848. PMID 14978049.CS1 maint: uses authors parameter (link)
- Taylor, C. Richard; Schmidt-Nielsen, Knut; Raab, J. L. (1970). "Scaling of energy cost of running to body size in mammals". American Journal of Physiology. 219 (4): 1104–1107. doi:10.1152/ajplegacy.1970.219.4.1104. PMID 5459475.
- Garland Jr., Theodore (1984). "Physiological correlates of locomotory performance in a lizard: an allometric approach" (PDF). American Journal of Physiology. 247 (5): R806–R815. doi:10.1152/ajpregu.1984.247.5.r806. PMID 6238543.
- Meek, Thomas H.; Lonquich, Brian P.; Hannon, Robert M.; Garland Jr., Theodore (2009). "Endurance capacity of mice selectively bred for high voluntary wheel running" (PDF). Journal of Experimental Biology. 212 (18): 2908–2917. doi:10.1242/jeb.028886. PMID 19717672. S2CID 127701.
- Huey, Raymond B.; Hertz, Paul E. (1982). "Effects of body size and slope on sprint speed of a lizard (Stellio (Agama) stellio)" (PDF). Journal of Experimental Biology. 97: 401–409.
- Huey, Raymond B.; Hertz, Paul E. (1984). "Effects of body size and slope on acceleration of a lizard (Stellio stellio)" (PDF). Journal of Experimental Biology. 110: 113–123.
- Mathis, Alexander; Mamidanna, Pranav; Cury, Kevin M.; Abe, Taiga; Murthy, Venkatesh N.; Mathis, Mackenzie Weygandt; Bethge, Matthias (September 2018). "DeepLabCut: markerless pose estimation of user-defined body parts with deep learning". Nature Neuroscience. 21 (9): 1281–1289. doi:10.1038/s41593-018-0209-y. ISSN 1097-6256.
- Xu, Tong (October 2019). "Single-view and Multi-view Methods in Marker-less 3D Human Motion Capture". Journal of Physics: Conference Series. 1335: 012022. doi:10.1088/1742-6596/1335/1/012022. ISSN 1742-6588.