Valchava
Valchava is a village in the Val Müstair (Müstair valley) of the canton of Graubünden (Grisons), Switzerland. It was an independent municipality in the district of Inn until on 1 January 2009 Valchava merged with Fuldera, Lü, Müstair, Santa Maria Val Müstair and Tschierv to form Val Müstair.[1]
Valchava | |
|---|---|
 Coat of arms | |
Location of Valchava 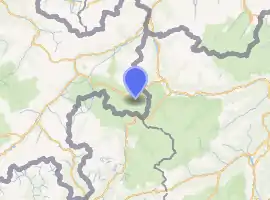
| |
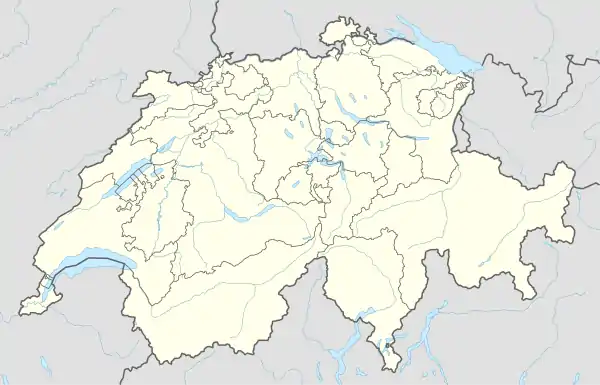 Valchava Valchava | |
| Coordinates: 46°36′N 10°24′E | |
| Country | Switzerland |
| Canton | Graubünden |
| District | Inn |
| Area | |
| • Total | 1,667 km2 (644 sq mi) |
| Elevation | 1,440 m (4,720 ft) |
| Population (December 2008) | |
| • Total | 203 |
| • Density | 0.12/km2 (0.32/sq mi) |
| Time zone | UTC+01:00 (Central European Time) |
| • Summer (DST) | UTC+02:00 (Central European Summer Time) |
| Postal code(s) | 7535 |
| SFOS number | 3846 |
| Website | www SFSO statistics |
History
Valchava is first mentioned in 1331 as Valchava.[2]
Geography
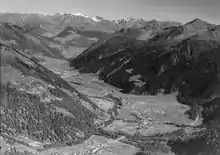
Valchava has an area, as of 2006, of 16.7 km2 (6.4 sq mi). Of this area, 46% is used for agricultural purposes, while 33.9% is forested. Of the rest of the land, 1.4% is settled (buildings or roads) and the remainder (18.7%) is non-productive (rivers, glaciers or mountains).[3]
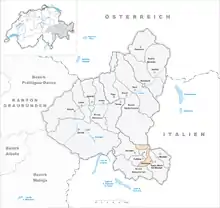
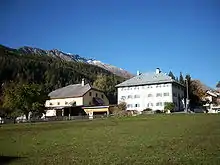
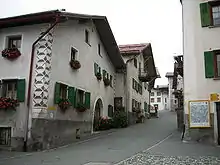
The village is located in the Val Müstair sub-district (now Val Müstair municipality) of the Inn district. It consists of the linear village of Valchava above Santa Maria Val Müstair and the alpine settlements of Chaunt and Valpaschun. Until 1943 Valchava was known as Valcava.[1]
Demographics
Valchava has a population (as of 2008) of 203, of which 3.4% are foreign nationals.[4] Over the last 10 years the population has decreased at a rate of -12%.[3]
As of 2000, the gender distribution of the population was 51.0% male and 49.0% female.[5] The age distribution, as of 2000, in Valchava is; 19 children or 9.4% of the population are between 0 and 9 years old. 19 teenagers or 9.4% are 10 to 14, and 12 teenagers or 5.9% are 15 to 19. Of the adult population, 20 people or 9.9% of the population are between 20 and 29 years old. 31 people or 15.3% are 30 to 39, 30 people or 14.9% are 40 to 49, and 25 people or 12.4% are 50 to 59. The senior population distribution is 24 people or 11.9% of the population are between 60 and 69 years old, 16 people or 7.9% are 70 to 79, there are 5 people or 2.5% who are 80 to 89, and there is 1 person who is 90 to 99.[4]
In the 2007 federal election the most popular party was the SVP which received 50.4% of the vote. The next three most popular parties were the SPS (37.4%), the CVP (8.9%) and the FDP (3%).[3]
In Valchava about 45.6% of the population (between age 25-64) have completed either non-mandatory upper secondary education or additional higher education (either University or a Fachhochschule).[3]
Valchava has an unemployment rate of 0.33%. As of 2005, there were 15 people employed in the primary economic sector and about 8 businesses involved in this sector. 14 people are employed in the secondary sector and there are 5 businesses in this sector. 24 people are employed in the tertiary sector, with 7 businesses in this sector.[3]
The historical population is given in the following table:[2]
| year | population |
|---|---|
| 1850 | 208 |
| 1900 | 218 |
| 1950 | 252 |
| 2000 | 202 |
Languages
Most of the population (as of 2000) speaks Rhaeto-Romance (80.7%), with German being second most common (18.3%) and Italian being third ( 1.0%).[3] The Romansh speaking population speaks the Jauer dialect. In 1880 about 69% of the population spoke Romansh as a first language. In 1910 it was 72%, in 1941 it was 75% and in 1970 it was 90%. In 1990 about 92% understood Romansh even if it wasn't their first language, and in 2000 it was also 92%.
| Languages in Valchava | ||||||
| Languages | Census 1980 | Census 1990 | Census 2000 | |||
| Number | Percent | Number | Percent | Number | Percent | |
| German | 44 | 20.18% | 31 | 15.20% | 37 | 18.32% |
| Romanish | 168 | 77.06% | 167 | 81.86% | 163 | 80.69% |
| Italian | 5 | 2.29% | 6 | 2.94% | 2 | 0.99% |
| Population | 218 | 100% | 204 | 100% | 202 | 100% |
References
- Amtliches Gemeindeverzeichnis der Schweiz published by the Swiss Federal Statistical Office (in German) accessed 23 September 2009
- Valchava in Romansh, German, French and Italian in the online Historical Dictionary of Switzerland.
- Swiss Federal Statistical Office Archived 2011-09-04 at the Wayback Machine accessed 14-Oct-2009
- Graubunden Population Statistics Archived 2009-08-27 at the Wayback Machine (in German) accessed 21 September 2009
- Graubunden in Numbers Archived 2009-09-24 at the Wayback Machine (in German) accessed 21 September 2009
| Wikimedia Commons has media related to Valchava. |