Willesden East (UK Parliament constituency)
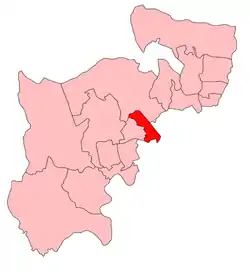
Willesden East (/wɪlzdən/) was a constituency in Middlesex adjoining the County of London and forming part of the London conurbation, in London itself from 1965. It returned one member to the House of Commons of the UK Parliament 1918 – 1974.
| Willesden East | |
|---|---|
| Former Borough constituency for the House of Commons | |
 Willesden East in Middlesex 1918-50 | |
| Major settlements | Cricklewood, approximately half of Neasden, Kilburn and part of Maida Vale |
| 1918–February 1974 | |
| Number of members | one |
| Replaced by | Brent East (similar boundaries) Brent South (small part of) |
| Created from | Harrow (small part of) |
The outcome of the seat was a bellwether of the national outcome from 1931 until its abolition. Before 1945 the seats electorate had not elected any Labour candidate, however had sided overall with the Liberal candidate once, in 1923, in a by-election.
Boundaries
1918–1950: The Urban District of Willesden wards of Brondesbury Park, Cricklewood, Kensal Rise, Mid Kilburn, North Kilburn, and South Kilburn.
1950–1974: The Municipal Borough of Willesden wards of Brondesbury Park, Carlton, Cricklewood, Kilburn, Mapesbury, and Neasden.
Members of Parliament
| Election | Member | Party | |
|---|---|---|---|
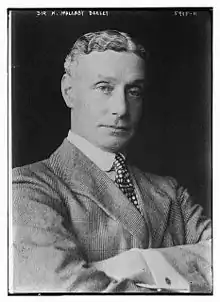
| 1918 | Sir Harry Mallaby-Deeley | Conservative | |
| 1923 by-election | Harcourt Johnstone | Liberal | |
| 1924 | George Stanley | Conservative | |
| 1929 | Daniel Somerville | Conservative | |
| 1938 by-election | Samuel Hammersley | Conservative | |
| 1945 | Maurice Orbach | Labour | |
| 1959 | Trevor Skeet | Conservative | |
| 1964 | Reg Freeson | Labour | |
| Feb 1974 | constituency abolished | ||
Elections
Elections in the 1910s

| Party | Candidate | Votes | % | ±% | |
|---|---|---|---|---|---|
| C | Unionist | Harry Mallaby-Deeley | 12,044 | 61.0 | |
| Labour | Henry James Lincoln | 4,941 | 25.0 | ||
| Liberal | Herbert John Doree | 2,757 | 14.0 | ||
| Majority | 7,103 | 36.0 | |||
| Turnout | 19,742 | 50.9 | |||
| Unionist win (new seat) | |||||
| C indicates candidate endorsed by the coalition government. | |||||
Elections in the 1920s
| Party | Candidate | Votes | % | ±% | |
|---|---|---|---|---|---|
| Unionist | Harry Mallaby-Deeley | 12,525 | 52.8 | -8.2 | |
| Liberal | Harcourt Johnstone | 11,211 | 47.2 | +33.2 | |
| Majority | 1,314 | 5.6 | -31.4 | ||
| Turnout | 23,736 | 58.4 | +7.5 | ||
| Unionist hold | Swing | -20.7 | |||
| Party | Candidate | Votes | % | ±% | |
|---|---|---|---|---|---|
| Liberal | Harcourt Johnstone | 14,824 | 60.6 | +13.4 | |
| Unionist | George Stanley | 9,648 | 39.4 | -13.4 | |
| Majority | 5,176 | 21.2 | N/A | ||
| Turnout | 24,472 | 60.2 | +1.8 | ||
| Liberal gain from Unionist | Swing | +13.4 | |||
| Party | Candidate | Votes | % | ±% | |
|---|---|---|---|---|---|
| Liberal | Harcourt Johnstone | 11,260 | 40.5 | -6.7 | |
| Unionist | George Stanley | 11,146 | 40.1 | -12.7 | |
| Labour | Joseph George Butler | 5,392 | 19.4 | New | |
| Majority | 114 | 0.4 | -5.2 | ||
| Turnout | 27,798 | 68.1 | +9.7 | ||
| Liberal hold | Swing | ||||
| Party | Candidate | Votes | % | ±% | |
|---|---|---|---|---|---|
| Unionist | George Stanley | 15,965 | 50.2 | +10.1 | |
| Liberal | Harcourt Johnstone | 7,992 | 25.1 | -15.4 | |
| Labour | William Davies Lloyd | 7,860 | 24.7 | +5.3 | |
| Majority | 7,973 | 25.1 | N/A | ||
| Turnout | 31,817 | 76.0 | +7.9 | ||
| Unionist gain from Liberal | Swing | +12.7 | |||
| Party | Candidate | Votes | % | ±% | |
|---|---|---|---|---|---|
| Unionist | Daniel Somerville | 17,090 | 40.4 | -9.8 | |
| Labour | William Davies Lloyd | 13,977 | 33.1 | +8.4 | |
| Liberal | Maurice Gordon Liverman | 11,190 | 26.5 | +1.4 | |
| Majority | 3,113 | 7.3 | -17.8 | ||
| Turnout | 42,257 | 69.3 | -6.7 | ||
| Unionist hold | Swing | -9.1 | |||
Elections in the 1930s
| Party | Candidate | Votes | % | ±% | |
|---|---|---|---|---|---|
| Conservative | Daniel Somerville | 28,993 | 62.1 | +21.7 | |
| Labour | William Davies Lloyd | 10,010 | 21.4 | -11.7 | |
| Liberal | Joseph Samuel Bridges | 7,684 | 16.5 | -10.0 | |
| Majority | 18,983 | 40.7 | +33.4 | ||
| Turnout | 46,687 | 68.3 | -1.0 | ||
| Conservative hold | Swing | +16.7 | |||
| Party | Candidate | Votes | % | ±% | |
|---|---|---|---|---|---|
| Conservative | Daniel Somerville | 25,613 | 57.7 | -4.4 | |
| Labour | Maurice Orbach | 15,523 | 35.0 | +13.6 | |
| Liberal | Nancy Stewart Parnell | 3,217 | 7.3 | -9.2 | |
| Majority | 10,090 | 22.7 | -18.0 | ||
| Turnout | 44,353 | 62.0 | -6.3 | ||
| Conservative hold | Swing | -9.0 | |||
| Party | Candidate | Votes | % | ±% | |
|---|---|---|---|---|---|
| Conservative | Samuel Hammersley | 16,009 | 56.6 | -1.1 | |
| Labour | Maurice Orbach | 12,278 | 43.4 | +8.4 | |
| Majority | 3,731 | 13.2 | -9.5 | ||
| Turnout | 44,353 | 39.3 | -22.7 | ||
| Conservative hold | Swing | -4.7 | |||
Elections in the 1940s
General Election 1939/40:
Another General Election was required to take place before the end of 1940. The political parties had been making preparations for an election to take place from 1939 and by the end of this year, the following candidates had been selected;
- Conservative: Samuel Hammersley
- Labour: Maurice Orbach
- Liberal: Arthur Shenfield
| Party | Candidate | Votes | % | ±% | |
|---|---|---|---|---|---|
| Labour | Maurice Orbach | 23,457 | 53.00 | +9.60 | |
| Conservative | Samuel Hammersley | 14,027 | 31.70 | -14.90 | |
| Liberal | RLR Morgan | 6,771 | 15.30 | +8.00 | |
| Majority | 9,430 | 21.30 | N/A | ||
| Turnout | 44,255 | 72.69 | +33.39 | ||
| Registered electors | 60,882 | ||||
| Labour gain from Conservative | Swing | +12.25 | |||
Elections in the 1950s
| Party | Candidate | Votes | % | ±% | |
|---|---|---|---|---|---|
| Labour | Maurice Orbach | 24,345 | 47.13 | -5.87 | |
| Conservative | Samuel Hammersley | 21,004 | 40.66 | +8.96 | |
| Liberal | Walter John Done | 6,310 | 12.21 | -3.09 | |
| Majority | 3,341 | 6.47 | -14.84 | ||
| Turnout | 51,659 | 82.53 | +9.84 | ||
| Registered electors | 62,596 | ||||
| Labour hold | Swing | -7.42 | |||
| Party | Candidate | Votes | % | ±% | |
|---|---|---|---|---|---|
| Labour | Maurice Orbach | 26,695 | 51.81 | +4.68 | |
| Conservative | Ronald E Simms | 24,827 | 48.19 | +7.53 | |
| Majority | 1,868 | 3.62 | -2.85 | ||
| Turnout | 51,522 | 81.83 | -0.70 | ||
| Registered electors | 62,962 | ||||
| Labour hold | Swing | -1.43 | |||
| Party | Candidate | Votes | % | ±% | |
|---|---|---|---|---|---|
| Labour | Maurice Orbach | 23,397 | 50.71 | -1.10 | |
| Conservative | Ronald E Simms | 22,738 | 49.29 | +1.10 | |
| Majority | 659 | 1.42 | -2.20 | ||
| Turnout | 46,135 | 76.13 | -5.70 | ||
| Registered electors | 60,604 | ||||
| Labour hold | Swing | -1.10 | |||
| Party | Candidate | Votes | % | ±% | |
|---|---|---|---|---|---|
| Conservative | Trevor Skeet | 22,709 | 52.56 | +3.27 | |
| Labour | Maurice Orbach | 20,499 | 47.44 | -3.27 | |
| Majority | 2,210 | 5.12 | N/A | ||
| Turnout | 43,208 | 73.40 | -2.73 | ||
| Registered electors | 58,865 | ||||
| Conservative gain from Labour | Swing | +3.27 | |||
Elections in the 1960s
| Party | Candidate | Votes | % | ±% | |
|---|---|---|---|---|---|
| Labour | Reg Freeson | 20,543 | 52.27 | +4.83 | |
| Conservative | Trevor Skeet | 18,755 | 47.73 | -4.83 | |
| Majority | 1,788 | 4.54 | N/A | ||
| Turnout | 39,298 | 68.76 | -4.64 | ||
| Registered electors | 57,153 | ||||
| Labour gain from Conservative | Swing | +4.83 | |||
| Party | Candidate | Votes | % | ±% | |
|---|---|---|---|---|---|
| Labour | Reg Freeson | 21,767 | 54.62 | +2.35 | |
| Conservative | Peter Fry | 14,761 | 37.04 | -10.69 | |
| Liberal | Malcolm H Brahams | 2,765 | 6.94 | New | |
| Independent | Olive Bysouth | 556 | 1.40 | New | |
| Majority | 7,006 | 17.58 | +13.04 | ||
| Turnout | 39,849 | 71.05 | +2.29 | ||
| Registered electors | 56,085 | ||||
| Labour hold | Swing | +6.52 | |||
Elections in the 1970s
| Party | Candidate | Votes | % | ±% | |
|---|---|---|---|---|---|
| Labour | Reg Freeson | 20,073 | 56.33 | +1.71 | |
| Conservative | Horace Cutler | 15,564 | 43.67 | +6.63 | |
| Majority | 4,509 | 12.66 | -4.92 | ||
| Turnout | 35,637 | 62.35 | -8.70 | ||
| Registered electors | 57,152 | ||||
| Labour hold | Swing | -2.46 | |||
References
- Kimber, Richard. "UK General Election results 1945". Political Science Resources. Retrieved 13 April 2016.
- Kimber, Richard. "UK General Election results 1950". Political Science Resources. Retrieved 13 April 2016.
- Kimber, Richard. "UK General Election results 1951". Political Science Resources. Retrieved 13 April 2016.
- Kimber, Richard. "UK General Election results 1955". Political Science Resources. Retrieved 13 April 2016.
- Kimber, Richard. "UK General Election results 1959". Political Science Resources. Retrieved 13 April 2016.
- Kimber, Richard. "UK General Election results 1964". Political Science Resources. Retrieved 13 April 2016.
- Kimber, Richard. "UK General Election results 1966". Political Science Resources. Retrieved 13 April 2016.
- Kimber, Richard. "UK General Election results 1970". Political Science Resources. Retrieved 13 April 2016.