1902 Northwest Territories general election
The 1902 Northwest Territories general election, occurred on 21 May 1902 and was the fifth general election in the history of the Northwest Territories, Canada. It was held to elect Members of the Legislative Assembly of the Northwest Territories. This was the last election held until 1951, and was the last in the Northwest Territories to have political parties.
| ||||||||||||||||||||||||||||
35 seats in the North-West Legislative Assembly 18 seats were needed for a majority | ||||||||||||||||||||||||||||
|---|---|---|---|---|---|---|---|---|---|---|---|---|---|---|---|---|---|---|---|---|---|---|---|---|---|---|---|---|
| ||||||||||||||||||||||||||||
| ||||||||||||||||||||||||||||
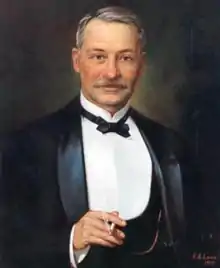
Frederick W. A. G. Haultain and the Liberal-Conservatives continued with government. Donald H. McDonald was thrust into being the Liberal leader just days before the vote, with the surprise decision by Robert Brett to drop out of the race.
In 1905, the provinces of Alberta and Saskatchewan were created out of NWT territory, and they took most of the voting population with them. The government of NWT reverted to an appointed consensus model of government.
Candidates in this election were not nominated by the party in a contested nomination as with modern elections, but rather proclaimed their support for the governing party or opposition party, or Independent. During the election race some candidates shifted their alignment. The result was a confusing mess, and the bulk of candidates proclaimed support for the already governing Liberal-Conservative party, leaving the Liberals without candidates in many districts. Lethbridge ended up being contested by two government supporting candidates.
1902 would also see the largest number of MLAs elected to the Northwest Territories Legislature in the territories history.
Election summary
| Party | Party Leader | # of candidates |
Elected | Popular Vote | ||
|---|---|---|---|---|---|---|
| # | % | |||||
| Liberal-Conservative | Frederick Haultain | 32 | 21 | 8,319 | 47.70% | |
| Liberal | Donald H. McDonald | 21 | 7 | 5,067 | 29.06% | |
| Independent | 11 | 6 | 3,381 | 19.39% | ||
| Independent Liberal | 1 | 1 | 362 | 2.07% | ||
| Independent Liberal-Conservative | 1 | - | 310 | 1.78% | ||
| Total | 66 | 35 | 17,439 | 100% | ||
Note:
- Sources are conflicted about the affiliation of some candidates, vote counts and total number of candidates are accurate, standings and votes by party may change upon further research.
Members of the Legislative Assembly elected
For complete electoral history, see individual districts
Note: * Sources are conflicted on Richard Bennett as to whether he was a Liberal or Independent
