1954 Pacific typhoon season
The 1954 Pacific typhoon season has no official bounds; it ran year-round in 1954, but most tropical cyclones tend to form in the northwestern Pacific Ocean between June and December. These dates conventionally delimit the period of each year when most tropical cyclones form in the northwestern Pacific Ocean.
| 1954 Pacific typhoon season | |
|---|---|
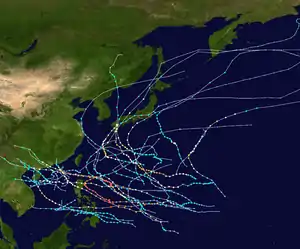 Season summary map | |
| Seasonal boundaries | |
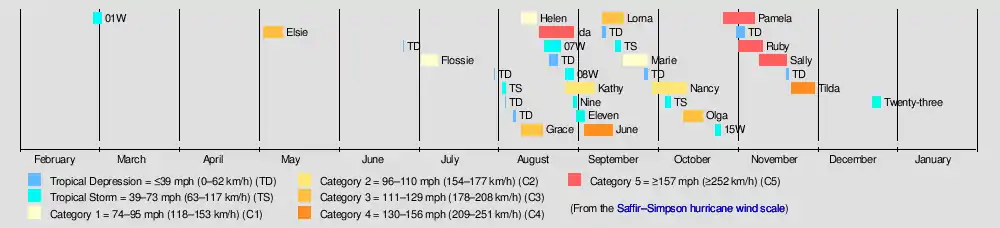
| First system formed | March 1, 1954 |
| Last system dissipated | December 26, 1954 |
| Strongest storm | |
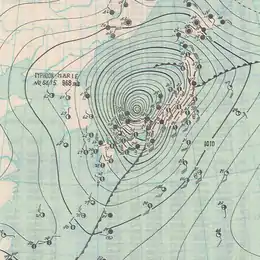
| Name | Ida |
| • Maximum winds | 280 km/h (175 mph) (1-minute sustained) |
| • Lowest pressure | 890 hPa (mbar) |
| Seasonal statistics | |
| Total depressions | 33 |
| Total storms | 19 |
| Typhoons | 15 |
| Super typhoons | 5 (unofficial) |
| Total fatalities | 1,530 |
| Total damage | Unknown |
| Related articles | |
The scope of this article is limited to the Pacific Ocean, north of the equator and west of the international date line. Storms that form east of the date line and north of the equator are called hurricanes; see 1954 Pacific hurricane season. Tropical Storms formed in the entire west Pacific basin were assigned a name by the Fleet Weather Center on Guam.
Systems
Tropical Storm 01W
| Tropical storm (SSHWS) | |
  | |
| Duration | March 1 – March 4 |
|---|---|
| Peak intensity | 95 km/h (60 mph) (1-min) 990 hPa (mbar) |
Typhoon Elsie
| Category 3 typhoon (SSHWS) | |
 | |
| Duration | May 5 – May 12 |
|---|---|
| Peak intensity | 185 km/h (115 mph) (1-min) 945 hPa (mbar) |
Typhoon Flossie
| Category 1 typhoon (SSHWS) | |
 | |
| Duration | July 4 – July 10 |
|---|---|
| Peak intensity | 140 km/h (85 mph) (1-min) 985 hPa (mbar) |
Typhoon Grace
| Category 3 typhoon (SSHWS) | |
 | |
| Duration | August 11 – August 19 |
|---|---|
| Peak intensity | 185 km/h (115 mph) (1-min) 940 hPa (mbar) |
Typhoon Grace struck the Southern Japanese islands of Kyūshū and Shikoku. 28 people were killed and 33 were missing.[1]
Typhoon Helen
| Category 1 typhoon (SSHWS) | |
 | |
| Duration | August 11 – August 17 |
|---|---|
| Peak intensity | 130 km/h (80 mph) (1-min) 965 hPa (mbar) |
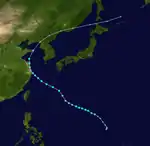
Typhoon Ida
| Category 5 super typhoon (SSHWS) | |
 | |
| Duration | August 18 – August 31 |
|---|---|
| Peak intensity | 280 km/h (175 mph) (1-min) 890 hPa (mbar) |
Tropical Storm 07W
| Tropical storm (SSHWS) | |
 | |
| Duration | August 20 – August 26 |
|---|---|
| Peak intensity | 75 km/h (45 mph) (1-min) 998 hPa (mbar) |
Tropical Storm 08W
| Tropical storm (SSHWS) | |
| | |
| Duration | August 28 – August 31 |
|---|---|
| Peak intensity | 75 km/h (45 mph) (1-min) 995 hPa (mbar) |
Typhoon Kathy
| Category 2 typhoon (SSHWS) | |
 | |
| Duration | August 28 – September 8 |
|---|---|
| Peak intensity | 165 km/h (105 mph) (1-min) 940 hPa (mbar) |
Typhoon June
| Category 4 super typhoon (SSHWS) | |
 | |
| Duration | September 4 – September 15 |
|---|---|
| Peak intensity | 240 km/h (150 mph) (1-min) 910 hPa (mbar) |
Typhoon June struck the Southern Japanese hitting the area west of Kanto especially hard. 107 people were killed and 39 were missing.[2]
Typhoon Lorna
| Category 3 typhoon (SSHWS) | |
 | |
| Duration | September 11 – September 19 |
|---|---|
| Peak intensity | 185 km/h (115 mph) (1-min) 950 hPa (mbar) |
Typhoon Lorna brushed the southern coast of the Japanese island of Shikoku. 34 people were killed and 20 were missing.[3]
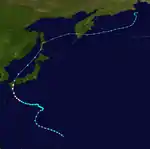
Typhoon Marie
| Category 1 typhoon (SSHWS) | |
  | |
| Duration | September 19 – September 28 |
|---|---|
| Peak intensity | 140 km/h (85 mph) (1-min) 956 hPa (mbar) |
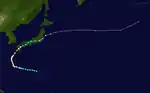
Typhoon Marie had a minimum pressure of 956 mb and a maximum windspeeds of 85 mph. Marie crossed the southern islands of Kyūshū and Shikoku before turning northeast and striking Hokkaidō island. Marie caused the ship Toya Maru to sink in the Tsugaru Strait. 1,361 people were killed and 400 were left missing.[4] Due to this disaster, the typhoon is known in Japan as the Toya Maru Typhoon.[5]
Typhoon Nancy
| Category 2 typhoon (SSHWS) | |
 | |
| Duration | September 30 – October 13 |
|---|---|
| Peak intensity | 155 km/h (100 mph) (1-min) 965 hPa (mbar) |
Typhoon Olga
| Category 3 typhoon (SSHWS) | |
 | |
| Duration | October 12 – October 19 |
|---|---|
| Peak intensity | 185 km/h (115 mph) (1-min) 935 hPa (mbar) |
Tropical Storm 15W
| Tropical storm (SSHWS) | |
 | |
| Duration | October 24 – October 26 |
|---|---|
| Peak intensity | 75 km/h (45 mph) (1-min) 1004 hPa (mbar) |
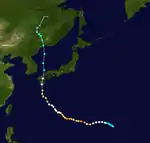
Typhoon Pamela
| Category 5 super typhoon (SSHWS) | |
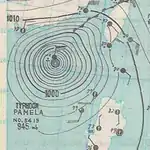  | |
| Duration | October 27 – November 8 |
|---|---|
| Peak intensity | 280 km/h (175 mph) (1-min) 900 hPa (mbar) |
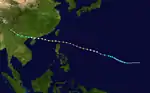
On October 27, Typhoon Pamela formed as a tropical depression. Pamela reached a peak of 900 mbar and 175 mph on November 1 and reached a secondary peak of 935 mbars on November 5. Pamela was one of three storms that reached Category 5 super typhoon status in the South China Sea, with others being Typhoon Rammasun of 2014 at 160 mph within 25 km east of Hainan island, and Typhoon Meranti of 2016, at 190 mph in the South China Sea within 100 km southwest of Taiwan.
Gusts at landfall just to the west of Macau reached 175 km/h in Waglan Island and 155 km/h in Hong Kong Observatory which were the strongest since November 10, 1900 when the mean hourly wind speed reached 113 km/h (71 mph or 61 kts) at the Royal Observatory in Tsim Sha Tsui, in par with Typhoon Gloria.
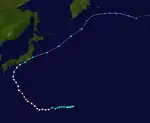
Typhoon Ruby
| Category 5 super typhoon (SSHWS) | |
 | |
| Duration | November 2 – November 11 |
|---|---|
| Peak intensity | 270 km/h (165 mph) (1-min) 940 hPa (mbar) |
Storm names
|
|
See also
References
- Digital Typhoon: Disaster Information
- Digital Typhoon: Disaster Information
- Digital Typhoon: Disaster Information
- Digital Typhoon: Disaster Information
- "洞爺丸台風 昭和29年(1954年9月24日~9月27日" (in Japanese). Japan Meteorological Agency. Retrieved September 28, 2018.