2004 Monaghan County Council election
An election to Monaghan County Council took place on 11 June 2004 as part of that year's Irish local elections. 20 councillors were elected from four electoral divisions by PR-STV voting for a five-year term of office.
| |||||||||||||||||||||||||||||||||
All 20 seats to Monaghan County Council | |||||||||||||||||||||||||||||||||
|---|---|---|---|---|---|---|---|---|---|---|---|---|---|---|---|---|---|---|---|---|---|---|---|---|---|---|---|---|---|---|---|---|---|
| |||||||||||||||||||||||||||||||||
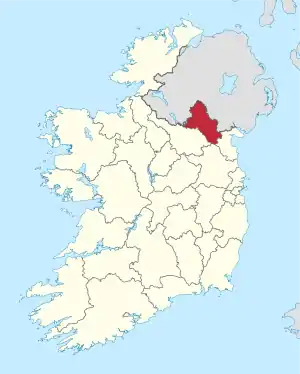 Map showing the area of Monaghan County Council | |||||||||||||||||||||||||||||||||
| |||||||||||||||||||||||||||||||||
Results by party
| Party | Seats | ± | First Pref. votes | FPv% | ±% | |
|---|---|---|---|---|---|---|
| Sinn Féin | 7 | +1 | 9,332 | 31.05 | ||
| Fine Gael | 7 | +1 | 8,982 | 29.89 | ||
| Fianna Fáil | 5 | -3 | 8,826 | 29.37 | ||
| Independent | 1 | +1 | 2,913 | 9.69 | ||
| Totals | 20 | - | 100% | — | ||
Results by Electoral Area
Carrickmacross
| Party | Candidate | FPv% | Count | ||||||||
|---|---|---|---|---|---|---|---|---|---|---|---|
| 1 | 2 | 3 | 4 | 5 | 6 | 7 | 8 | ||||
| Sinn Féin | Matt Carthy | 17.77 | 1,408 | ||||||||
| Fianna Fáil | Pádraig McNally* | 16.86 | 1,336 | ||||||||
| Sinn Féin | Noel Keelan* | 12.75 | 1,010 | 1,031 | 1,094 | 1,150 | 1,174 | 1,176 | 1,239 | 1,300 | |
| Independent | Vincent P. Martin | 11.08 | 878 | 893 | 901 | 979 | 1,066 | 1,068 | 1,179 | 1,371 | |
| Fine Gael | John Keenan | 8.14 | 645 | 650 | 652 | 662 | 813 | 814 | 841 | 1,248 | |
| Fine Gael | Aidan Murray* | 7.83 | 620 | 644 | 645 | 689 | 807 | 808 | 839 | ||
| Fianna Fáil | Rosaleen O'Hanlon* | 7.19 | 570 | 607 | 610 | 636 | 655 | 659 | 968 | 1,026 | |
| Fianna Fáil | Shane O'Hanlon* | 6.65 | 527 | 570 | 573 | 614 | 651 | 656 | |||
| Fine Gael | Denis Durcan | 5.36 | 425 | 431 | 434 | 466 | |||||
| Independent | Tom Freeman | 3.85 | 305 | 337 | 341 | ||||||
| Fianna Fáil | Brian Connolly | 2.51 | 199 | ||||||||
| Electorate: 11,094 Valid: 7,923 (71.42%) Spoilt: 194 Quota: 1,321 Turnout: 8,117 (73.17%) | |||||||||||
Castleblayney
| Party | Candidate | FPv% | Count | |||||
|---|---|---|---|---|---|---|---|---|
| 1 | 2 | 3 | 4 | 5 | ||||
| Sinn Féin | Jackie Crowe* | 19.52 | 1,415 | |||||
| Fine Gael | Owen Bannigan* | 17.84 | 1,293 | |||||
| Fianna Fáil | John O'Brien* | 15.66 | 1,135 | 1,165 | 1,176 | 1,295 | ||
| Fine Gael | Gary Carville* | 15.34 | 1,112 | 1,159 | 1,207 | 1,458 | ||
| Fianna Fáil | Seamus Coyle | 10.70 | 951 | 976 | 992 | 1,090 | 1,167 | |
| Fianna Fáil | Brendan Hughes* | 9.50 | 751 | 793 | 795 | 884 | 946 | |
| Independent | Joe Brennan | 3.39 | 591 | 653 | 660 | |||
| Electorate: 10,701 Valid: 7,248 (67.73%) Spoilt: 91 Quota: 1,209 Turnout: 7,339 (68.58%) | ||||||||
Clones
| Party | Candidate | FPv% | Count | ||||
|---|---|---|---|---|---|---|---|
| 1 | 2 | 3 | 4 | ||||
| Fine Gael | Hugh McElvaney* | 19.16 | 1,154 | 1,233 | |||
| Fine Gael | Heather Humphreys* | 18.11 | 1,091 | 1,145 | 1,161 | 1,195 | |
| Sinn Féin | Pat Treanor | 14.05 | 846 | 951 | 1,437 | ||
| Independent | Brendan Casey | 16.93 | 795 | 872 | 978 | 1,093 | |
| Sinn Féin | Sheila McKenna* | 13.97 | 730 | 753 | |||
| Fianna Fáil | Benny Kieran | 11.65 | 723 | 1,035 | 1,123 | 1,206 | |
| Fianna Fáil | Eugene McCaughey | 8.68 | 684 | ||||
| Electorate: 8,859 Valid: 6,023 (67.99%) Spoilt: 123 Quota: 1,205 Turnout: 6,146 (69.38%) | |||||||
Monaghan
| Party | Candidate | FPv% | Count | ||||||
|---|---|---|---|---|---|---|---|---|---|
| 1 | 2 | 3 | 4 | 5 | 6 | ||||
| Sinn Féin | Seán Conlon* | 16.13 | 1,429 | ||||||
| Fianna Fáil | Robbie Gallagher | 15.72 | 1,393 | ||||||
| Sinn Féin | Brian McKenna* | 15.37 | 1,362 | ||||||
| Sinn Féin | Brenda McAnespie* | 12.78 | 1,132 | 1,261 | 1,276 | ||||
| Fine Gael | David Maxwell | 11.95 | 1,059 | 1,068 | 1,080 | 1,112 | 1,118 | 1,236 | |
| Fine Gael | Pat McKenna* | 10.20 | 904 | 908 | 915 | 1,001 | 1,035 | 1,198 | |
| Fine Gael | Eugene Sherry | 7.66 | 679 | 684 | 693 | 734 | 765 | 870 | |
| Fianna Fáil | Emer Brennan | 6.29 | 557 | 566 | 645 | 708 | 733 | ||
| Independent | Plunkett McKenna | 3.88 | 344 | 351 | 356 | ||||
| Electorate: 14,669 Valid: 8,859 (60.39%) Spoilt: 262 Quota: 1,266 Turnout: 9,121 (62.18%) | |||||||||
External links
| Preceded by 1999 Monaghan County Council election |
Monaghan County Council elections | Succeeded by 2009 Monaghan County Council election |
This article is issued from Wikipedia. The text is licensed under Creative Commons - Attribution - Sharealike. Additional terms may apply for the media files.