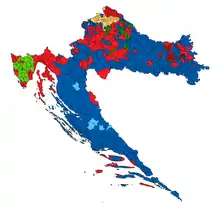
2007 Croatian parliamentary election
Parliamentary elections were held in Croatia on 25 November 2007 and for overseas voters on 24 and 25 November.[1] The campaign officially started on 3 November. The President of Croatia announced elections on 17 October and 14 days were allowed for candidate lists to be submitted.
| |||||||||||||||||||||||||||||||||||||||||||||||||||||
All 153 seats to Hrvatski sabor 77 seats needed for a majority | |||||||||||||||||||||||||||||||||||||||||||||||||||||
|---|---|---|---|---|---|---|---|---|---|---|---|---|---|---|---|---|---|---|---|---|---|---|---|---|---|---|---|---|---|---|---|---|---|---|---|---|---|---|---|---|---|---|---|---|---|---|---|---|---|---|---|---|---|
| Turnout | 59.5% | ||||||||||||||||||||||||||||||||||||||||||||||||||||
| |||||||||||||||||||||||||||||||||||||||||||||||||||||
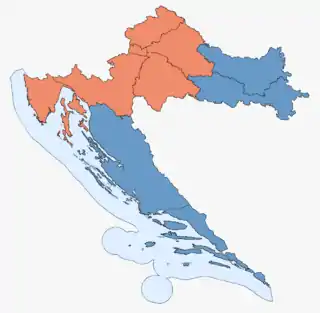 Results of the election in each of the ten electoral districts of Croatia: the party with the plurality of votes in each electoral unit. HDZ: blue; SDP: red | |||||||||||||||||||||||||||||||||||||||||||||||||||||
| |||||||||||||||||||||||||||||||||||||||||||||||||||||
| 2000 election • MPs |
| 2003 election • MPs |
| 2007 election • MPs |
| 2011 election • MPs |
 |
|---|
| This article is part of a series on the politics and government of Croatia |
Elections were held in 10 electoral districts inside Croatia (each providing 14 members of parliament),[2] one electoral district for Croatian citizens living abroad (with a maximum 12 members of parliament), and one electoral district for national minorities (8 members of parliament). Candidate lists have to win more than 5% of the votes in at least one electoral district in order to be represented in the parliament. 4,478,386 people in total were eligible to vote, 405,092 of whom are in the diaspora, 280,000 living in Bosnia-Herzegovina.[3][4]
To prevent possible electoral fraud, such as votes from the deceased, or people voting twice in different locations, the Croatians outside Croatia who were eligible to vote had to register no later than 14 days before the election.
In three locales, the election were repeated on 9 December 2007; while this could not and did not change the final result as far as mandates are concerned, it meant the final result became known only on 11 December 2007.[5]
The governing centre-right Croatian Democratic Union emerged as the relative winner of the election, but failed to obtain an outright majority. The opposition centre-left Social Democratic Party of Croatia achieved their best result ever as a party, but were unsuccessful in their attempt to become the strongest single party. The election resulted in the formation of the Sanader II cabinet supported by HDZ, HSS, HSLS and the representatives of national minorities.
Electoral lists
Croatian political parties and independent lists had to formally submit their candidates and eventual pre-election coalitions not later than 30 October. 3585 people from political parties or independent lists applied for the elections (22 people per seat). There were 235 political party lists, 16 independent lists and 72 candidates for minority seats. 29.93% of the candidates were women. The average age of the candidates was 43.41 years old; 44.70 for men, and 40.40 for women. The oldest candidate was 89, and the youngest 18. The State Electoral Committee had to confirm the lists before midnight of 2 November.[6][7]
Parliamentary parties and coalitions
- Croatian Democratic Union (HDZ)
- Social Democratic Party (SDP)
- Croatian Peasant Party–Croatian Social Liberal Party-Alliance of Primorje-Gorski Kotar-Democratic Party of Zagorje-Zagorje Party) (HSS-HSLS-PGS-ZDS-ZS)
- Croatian People's Party – Liberal Democrats (HNS)
- Istrian Democratic Assembly (IDS)
- Croatian Party of Right (HSP)
- Croatian Democratic Alliance of Slavonia and Baranja (HDSSB)
- Croatian Party of Pensioners (coalition with Democratic Party of Pensioners) (HSU)
- Democratic Centre-Green Party – Green Alternative (DC-Zeleni)
- Independent Democratic Serb Party (national minorities electorate and 9th electorate) (SDSS)
- Political parties and lists of national minorities (12th electorate)
Parliamentary parties are with bolded acronyms.
Non-parliamentary parties
- Croatian Youth Party (HSM)
- Croatian Democratic Peasants' Party (HDSS)
- Croatian Pure Party of Right (HČSP)
- Croatian Christian Democratic Union (HKDU)
- Croatian Christian Democrats (Demokršćani)
- United Supporters of the Croatian Party of Right Movement (HP-HPP)
- Green List of Croatia (Zelena lista)
- Only Croatia – Movement for Croatia (Jedino Hrvatska)
Non-parliamentary coalitions
- "Left Coalition": Left of Croatia-Socialist Labour Party of Croatia-Istrian Social Democratic Forum-Croatian Socialdemocrats (Ljevica-SRP-ISDF-HSD)
- "United Left": Social Democratic Action of Croatia-Croatian Labour Party-Green Party-Adriatic Social Democratic Party of Croatia. In some electorates also with Women's Democratic Party. (ASH-HRS-ZS-JSD-DSŽ)
- Croatian Christian Democratic Party–Christian Social Union (HKSS-KSU)
- Democratic Union of Međimurje–Slavonia-Baranja Croatian Party–Dalmatian Liberal Party (in some electorates with Alliance of Primorje-Gorski Kotar) (DSM-SBHS-DLS-PGS)
- Greens of Croatia-Women's Democratic Party (Zeleni HR-DSŽ)
- Party of Pensioners-Istrian Social Democratic Independent Party (SU-ISDNS)
Independent Lists
- Slaven Letica
- Boris Mikšić
- Hrvoje Hitrec
- Ivan Lončar
- Drago Krpina
- Tonči Tadić
- Jerko Ivanković Lijanović
Distribution of minority seats
- Serbs: 3
- Hungarians: 1
- Italians: 1
- Czechs and Slovaks: 1
- Austrians, Bulgarians, Germans, Poles, Romani, Romanians, Rusyns, Russians, Turks, Ukrainians, Vlachs and Jews: 1
- Albanians, Bosniaks, Montenegrins, Macedonians, Slovenes: 1
Announced boycotts
- Marginal right wing Croatian Party of Right 1861 decided not to participate in the 2007 elections as they claimed the elections were unconstitutional.[9]
Election spending
On 11 December 2007 GONG and Transparency International Croatia had published media spending of all Croatian political parties during the election period. This numbers are :
- Croatian Democratic Union 25,476,833 HRK or 51.9% of total
- Social Democratic Party of Croatia 8,150,728 HRK or 16.6% of total
- Croatian Peasant Party-Croatian Social Liberal Party 4,923,277 HRK or 10.0% of total
- Croatian People's Party 4,204,998 HRK or 8.6% of total
- Croatian Party of Right 3,082,071 HRK or 6.1% of total
- Istrian Democratic Assembly 611,406 HRK or 1.2% of total
- Croatian Party of Pensioners 520,362 HRK or 1.1% of total
- Only Croatia – Movement for Croatia 348,686 HRK or 0.7% of total
- Democratic Centre 329,151 HRK or 0.7 of total
- Croatian Democratic Alliance of Slavonia and Baranja 283,212 HRK or 0.6% of total
12 electorates in Croatia
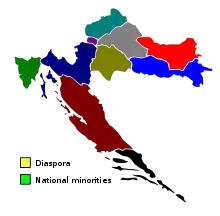
Since 1999 Croatia has been divided into 10 geographically-based electorates with around 250 000 - 300 000 registered voters. Each electorate elects up to 14 MPs chosen by the standard D'Hondt formula.[2]
In the 11th electorate, up to 12 members are chosen by proportional representation - depending on a number of voters in Croatia - to represent Croatian citizens residing abroad (known as the diaspora electorate) and 8 members from ethnic/national minorities.
It has to be noted that in Croatia, the official threshold is 5% for parties and coalitions. However, since the country is divided in 10 voting districts with 14 elected representatives each, sometimes the threshold can be higher, depending on the number of "fallen lists" (lists that don't get at least 5%). If many votes are lost in this manner, a list that gets barely more than 5% will still get a seat, whereas if there is a small number of parties that all pass the threshold, the actual ("natural") threshold is close to 7.15%.
This system is greatly favorable to regional parties, i.e. parties that gain their votes in a single electorate (see IDS, HDSSB), and it is disfavorable to parties that have greater numbers but are widespread throughout the nation (see HSU and HSP).
This made also the forming of post-electoral coalitions somewhat unpredictable, as the overall success of one of the greatest parties can effectively turn out to be counterproductive if it is achieved at the expense of their foreseeable partner, causing them to not pass the threshold in some or all electorates (it happened to the HDZ-led coalition in previous 2003 election).
Opinion polling
| Date | Polling Organisation/Client | Sample size | HDZ | SDP | HNS-LD | HSS | HSP | HSLS | HSU | Other | Undecided | Lead |
|---|---|---|---|---|---|---|---|---|---|---|---|---|
| 11/2007 | Puls | 1,300 | 32.5% | 33.4% | 5.9% | 6.6% | 3.8% | (HSS-HSLS) | 4.8% | 0.9% | ||
| 11/2007 | Media Metar | 1,300 | 33.9% | 36.2% | 6.8% | 5.4% | 5.2% | (HSS-HSLS) | 5.7% | 2.3% | ||
| 11/2007 | CRO Demoskop | 1,300 | 28.5% | 31.2% | 5.2% | 5.5% | 4.6% | (HSS-HSLS) | 6.2% | 2.7% | ||
| 10/2007 | Puls | 1,300 | 28.7% | 30.9% | 5.1% | 5.6% | 5.0% | (HSS-HSLS) | 5.9% | 2.2% | ||
| 10/2007 | CRO Demoskop | 1,300 | 26.4% | 30.1% | 5.8% | 7.3% | 6.4% | (HSS-HSLS) | 6.0% | 3.7% | ||
| 9/2007 | Puls | 1,300 | 26.5% | 31.6% | 5.3% | 5.9% | 6.9% | (HSS-HSLS) | 6.5% | 5.1% | ||
| 9/2007 | CRO Demoskop | 1,300 | 25.6% | 29.2% | 5.6% | 7.8% | 6.8% | (HSS-HSLS) | 5.6% | 3.6% | ||
| 8/2007 | Puls | 1,300 | 24% | 29% | 5% | 9% | 8% | (HSS-HSLS) | 8% | 5.0% | ||
| 7/2007 | Puls | 1,300 | 25.5% | 30.1% | 5.8% | 6.8% | 7.6% | (HSS-HSLS) | 6.4% | 4.6% | ||
| 6/2007 | Puls | 1,300 | 23.2% | 30.0% | 6.3% | 5.1% | 9.0% | (HSS-HSLS) | 6.9% | 6.8% | ||
| 5/2007 | Puls | 1,300 | 24.5% | 28.7% | 8.5% | 6.4% | 7.3% | (HSS-HSLS) | 6.5% | 4.2% | ||
| 4/2007 | Puls | 1,300 | 23.1% | 20.4% | 9.1% | 10.4% | 8.5% | (HSS-HSLS) | 7.6% | 2.7% | ||
| 3/2007 | Puls | 1,300 | 22.8% | 18.8% | 10.4% | 7.7% | 6.6% | 3.8% | 7.6% | 4.0% | ||
| 2/2007 | Puls | 1,300 | 23.4% | 19.5% | 9% | 9.6% | 8.8% | 4.2% | 6.3% | 3.9% | ||
| 12/2006 | Puls | 1,300 | 21% | 16% | 9% | 10% | 8% | 5% | 6% | 5.0% | ||
| 12/2006 | CRO Demoskop | 1,300 | 23.9% | 24.3% | 8.6% | 6.4% | 8.2% | 3.5% | 5.2% | 13.7% | 0.4% | |
| 10/2006 | CRO Demoskop | 1,300 | 26.1% | 25.7% | 8.6% | 5.9% | 8.0% | 4.5% | 5.1% | 10.4% | 0.4% | |
| 9/2006 | CRO Demoskop | 1,300 | 26.4% | 25.5% | 7.9% | 5.8% | 8.1% | 4.1% | 5.0% | 11.3% | 0.9% | |
| 8/2006 | CRO Demoskop | 1,300 | 26.3% | 25.2% | 8.1% | 5.7% | 8.1% | 4.0% | 5.1% | 11.1% | 1.1% | |
| 7/2006 | CRO Demoskop | 1,300 | 26.2% | 25.3% | 8.1% | 5.2% | 8.2% | 3.9% | 4.8% | 12.4% | 0.9% | |
| 6/2006 | CRO Demoskop | 1,300 | 26.2% | 26.1% | 7.6% | 5.4% | 8.2% | 3.9% | 5.1% | 11.7% | 0.1% | |
| 5/2006 | CRO Demoskop | 1,300 | 25.0% | 26.7% | 6.9% | 5.4% | 8.0% | 3.7% | 4.8% | 13.4% | 1.7% | |
| 4/2006 | CRO Demoskop | 1,300 | 25.2% | 27.5% | 7.3% | 4.3% | 8.0% | 3.5% | 4.1% | 13.5% | 2.3% | |
| 3/2006 | CRO Demoskop | 1,300 | 25.8% | 26.5% | 6.7% | 5.6% | 8.5% | 4.6% | 5.1% | 12.5% | 0.7% | |
| 2/2006 | CRO Demoskop | 1,300 | 26.4% | 25.5% | 7.4% | 5.7% | 9.3% | 4.6% | 3.9% | 11.8% | 0.9% | |
| 1/2006 | CRO Demoskop | 1,300 | 24.1% | 26.3% | 7.2% | 5.4% | 10.4% | 3.5% | 4.0% | 14.2% | 2.2% | |
| 12/2005 | Puls | 1,000 | 19.4% | 22.2% | 5.7% | 9.7% | 14.2% | 4.5% | 7.9% | 2.8% | ||
| 12/2005 | CRO Demoskop | 1,300 | 21.6% | 26.9% | 6.6% | 5.2% | 12.2% | 2.9% | 4.1% | 14.1% | 5.3% | |
| 11/2005 | CRO Demoskop | 1,300 | 24.9% | 26.8% | 7% | 4.7% | 11% | 2.6% | 3.7% | 13.4% | 1.9% | |
| 10/2005 | CRO Demoskop | 1,300 | 25.5% | 25.1% | 7.3% | 5.1% | 11.7% | 2% | 3.7% | 12.1% | 0.4% | |
| 9/2005 | Mediana fides | 1,006 | 26.9% | 34.1% | - | - | 12.7% | - | - | 7.2% | ||
| 9/2005 | Puls | 20.0% | 22.0% | 7.0% | 8.0% | 13.0% | 4.0% | 10.0% | 2.0% | |||
| 9/2005 | CRO Demoskop | 1,300 | 24.4% | 25.6% | 8.1% | 4.7% | 11.6% | 2.2% | 3.6% | 12.1% | 1.2% | |
| 8/2005 | CRO Demoskop | 1,300 | 24.8% | 25.4% | 8% | 5.1% | 10.9% | 2.8% | 3.1% | 12.2% | 0.6% | |
| 7/2005 | CRO Demoskop | 1,300 | 25.4% | 25.3% | 7.3% | 5.2% | 10.8% | 2.4% | 3.2% | 11.8% | 0.1% | |
| 6/2005 | CRO Demoskop | 1,300 | 25.3% | 24.8% | 6.8% | 6.5% | 10.8% | 2.1% | 3.6% | 13% | 0.5% | |
| 5/2005 | CRO Demoskop | 1,300 | 25.3% | 25% | 7.3% | 6.2% | 10.8% | 2.5% | 3.5% | 10.7% | 0.3% | |
| 4/2005 | Mediana | - | 13.8% | 19.8% | 3.4% | 2.5% | 7% | - | - | 6.0% | ||
| 4/2005 | CRO Demoskop | 1,300 | 26.2% | 26% | 8.2% | 5.6% | 9.3% | 2.4% | 2.1% | 13.7% | 0.2% | |
| 3/2005 | CRO Demoskop | 1,300 | 27.1% | 26.8% | 8.7% | 4.9% | 9.7% | 2.1% | 2.1% | 13.4% | 0.3% | |
| 2/2005 | Večernji list | 1,300 | 24.6% | 26.7% | 9.8% | - | 8.3% | - | - | 3.1% | ||
| 2/2005 | CRO Demoskop | 1,300 | 27.7% | 27.4% | 9.9% | 5.6% | 8% | 2.4% | 1.5% | 12.2% | 0.3% | |
| 1/2005 | CRO Demoskop | 1,300 | 27.1% | 25.8% | 9.3% | 6.6% | 8.1% | 3% | 1.2% | 14.4% | 1.3% | |
| 12/2004 | CRO Demoskop | 1,300 | 27.4% | 25% | 10.3% | 4,8% | 7.1% | 4.2% | 1.2% | 14.1% | 2.4% | |
| 11/2004 | Večernji list | 1,300 | 22.8% | 22.4% | - | - | - | - | - | 0.4% | ||
| 11/2004 | CRO Demoskop | 1,300 | 28.2% | 24.2% | 9.6% | 5.1% | 8.2% | 2.8% | 2% | 13,9% | 4.0% | |
| 10/2004 | Večernji list | 1,300 | 27.0% | 18.9% | - | - | - | - | - | 7.1% | ||
| 7/2004 | Promocija plus | 1,300 | 33.3% | 23.2% | 10.5% | 4.2% | 3.0% | 7.3 | 2.1% | 10.1% | ||
| 6/2004 | Promocija plus | 1,300 | 31.8% | 22.8% | - | - | - | - | - | 9.0% | ||
| 3/2004 | Promocija plus | 1,300 | 32.9% | 21.6% | 8.5% | 3.3% | 6.5% | 1.5% | 3.8% | 11.3% | ||
| 2/2004 | Promocija plus | 1,300 | 31.9% | 18.9% | 10.5% | 4.2% | 4.4% | - | 4.4% | 13.0% | ||
| 23 Nov | 2003 parliamentary election | 2,478,967 | 33.9% | 22.6% | 8.0% | 7.2% | 6.4% | 4.0% | 4.0% | N/A | 11.3% |
Results
Summary
| Parties and coalitions | Votes | % | Seats | % | +/– | |
|---|---|---|---|---|---|---|
| Croatian Democratic Union (Hrvatska demokratska zajednica) | 907,724 | 36.6 | 66 | 43.1 | ±0 | |
| Social Democratic Party of Croatia (Socijaldemokratska partija Hrvatske) | 775,690 | 31.3 | 56 | 36.6 | +22 | |
| "Green-Yellow Coalition" (Zeleno-žuta koalicija) | Croatian Peasant Party (Hrvatska seljačka stranka) | 161,814 | 6.5 | 6 | 3.9 | –4 |
| Croatian Social Liberal Party (Hrvatska socijalno liberalna stranka) | 2 | 1.3 | ±0 | |||
| Alliance of Primorje-Gorski Kotar (Primorsko-goranski savez) | 0 | 0.0 | –1 | |||
| Democratic Party of Zagorje (Zagorska demokratska stranka) | 0 | 0.0 | — | |||
| Zagorje Party (Zagorska stranka) | 0 | 0.0 | — | |||
| Croatian People's Party – Liberal Democrats (Hrvatska narodna stranka - Liberalni demokrati) | 168,440 | 6.8 | 7 | 4.6 | –4 | |
| Istrian Democratic Assembly (Istarski demokratski sabor/Dieta democratica Istriana) | 38,267 | 1.5 | 3 | 2.0 | –1 | |
| Croatian Democratic Alliance of Slavonija and Baranja (Hrvatski demokratski savez Slavonije i Baranje) | 44,552 | 1.8 | 3 | 2.0 | +3 | |
| Coalition | Croatian Party of Pensioners (Hrvatska stranka umirovljenika) | 101,091 | 4.1 | 1 | 0.7 | –2 |
| Democratic Party of Pensioners (Demokratska stranka umirovljenika) | 0 | 0.0 | — | |||
| Croatian Party of Rights (Hrvatska stranka prava) | 86,863 | 3.5 | 1 | 0.7 | –7 | |
| Others | 194,577 | 7.8 | 0 | 0.0 | –7 | |
| Independent Democratic Serb Party (Samostalna demokratska srpska stranka) (national minority list) | Enrolments and vote totals do not include voters for ethnic minority representatives. | 3 | 2.0 | ±0 | ||
| Party of Democratic Action of Croatia (Stranka Demokratske Akcije Hrvatske) (national minority list) | 1 | 0.7 | ±0 | |||
| Other national minority representatives | 4 | 2.6 | ±0 | |||
| Total | 2,479,018 | 100.0 | 153 | 100 | — | |
| Sources: State Election Committee[10] | ||||||
Analysis
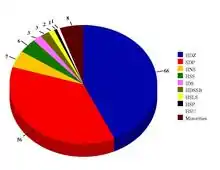
Most polls a couple of days before the election were predicting a very tight race between the governing Croatian Democratic Union and the opposition Social Democratic Party of Croatia. On the night of the election, after all the polls around the country closed, all major television networks released the results of the exit polls. All of them showed the social democrats with a slight lead.[11] None of the exit polls, however, took into account the votes coming from the citizens living abroad, which tend to vote for the more conservative option. The first official results published at 9 p.m. showed HDZ with a slight lead.[12] Ivo Sanader gave a victory speech close to midnight saying he will be forming the next government. Despite the election loss, SDP individually as a party achieved its best result ever, even better than the 2000 election result when SDP led a victorious coalition. Most smaller parties lost seats, the Croatian People's Party - Liberal Democrats lost 4 seats from the 2003 election, the Croatian Peasant Party also lost 4 seats and the far-right Croatian Party of Rights suffered its worst election results since the 1990s losing 7 seats and winning only 1.
National minorities elected 8 representatives through a separate election system: Milorad Pupovac (25,3% of votes), Vojislav Stanimirović (21,5%) and Ratko Gajica (15,8%) for the Serb national minority, Deneš Šoja (47,8%) for the Hungarian minority, Furio Radin (88,8%) for the Italian minority, Zdenka Čuhnil (26%) for the Czech and Slovak minorities, Nazif Memedi (12,8%) for the Austrian, Bulgarian, German, Jewish, Polish, Roma, Romanian, Rusyn, Russian, Turkish, Ukrainian, Vlach minorities and Šemso Tanković (30,9%) for the Albanian, Bosniak, Macedonian, Montenegrin and Slovene minorities.
Turnout
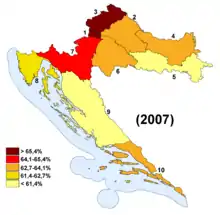
| district | I | II | III | IV | V | VI | VII | VIII | IX | X | XI | total |
|---|---|---|---|---|---|---|---|---|---|---|---|---|
| voters total | 361 236 | 399 648 | 366 005 | 335 091 | 372 163 | 356 575 | 403 812 | 385 594 | 426 199 | 416 017 | 404 950 | 4 227 290 |
| votes cast | 243 980 | 254 571 | 249 111 | 211 839 | 216 335 | 224 986 | 264 795 | 240 250 | 259 018 | 264 193 | 90 482 | 2 519 560 |
| valid votes | 243 480 | 254 269 | 249 041 | 211 426 | 215 937 | 224 554 | 264 232 | 239 987 | 258 593 | 263 372 | 90 402 | 2 515 293 |
| turnout | 67,4% | 63,6% | 68,0% | 63,1% | 58,0% | 63,0% | 65,4% | 62,2% | 60,7% | 63,3% | 22,3% | 59,5% |
| Source: | ||||||||||||
Results for each electoral district
| district | I | II | III | IV | V | VI | VII | VIII | IX | X |
|---|---|---|---|---|---|---|---|---|---|---|
| HDZ | 31,03 % | 31,83% | 23,85% | 31,20% | 42,75% | 34,23% | 35,14% | 21,16% | 52,09% | 44,54% |
| SDP | 42,07 % | 33,33% | 30,79% | 26,80% | 26,69% | 36,08% | 36,90% | 40,99% | 22,63% | 28,27% |
| HNS | 6,43 % | 4,47% | 25,34% | 4,64% | 4,31% | 5,42% | 5,52% | 5,21% | 3,79% | 4,83% |
| HSLS-HSS | 4,38% | 16,53% | 9,95% | 4,04% | 5,54% | 8,27% | 6,49% | 2,93% | 3,29% | 5,71% |
| HSU | 4,87% | 4,29% | 3,53% | 4,89% | 3,71% | 4,44% | 4,53% | 5,85% | 3,38% | 3,03% |
| HSP | 2,40% | 2,93% | 1,67% | 7,98% | 5,19% | 3,44% | 3,25% | 1,81% | 3,43% | 3,49% |
| HDSSB | — | — | — | 15,23% | 6,00% | — | — | — | — | — |
| IDS | — | — | — | — | — | — | — | 16,18% | — | — |
| Source: | ||||||||||
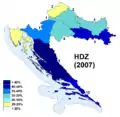 HDZ result
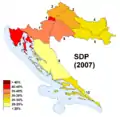 SDP result
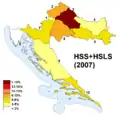 HSS-HSLS result
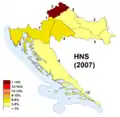 HNS result
Government formation
On night of the elections, after first seat projections were announced, the president of the Croatian Democratic Union announced that he spoke with the President of the Republic and that he will be forming the government.[13] A few minutes after him, the president of the Social Democratic Party informed the public that he too spoke with president and that he too was commencing the formation of the government.[13]
President Mesić explained that his constitutional obligation was to give a mandate to form a government to a person who presents him with convincing proof that they have support of a majority of the newly elected parliament.[14] As the president failed to announce that he will give the mandate to Ivo Sanader, leader of the party with the most seats in the parliament, he was criticised by many[15][16][17] for complicating the situation and starting a political crisis. President Mesić responded that he was following article 97 of the Constitution of Croatia.[15]
HDZ, together with HSU [18] and Roma national minority member Nazif Memedi [19] had 68 of 77 seats required for a majority while SDP, HNS, IDS [20] and SDA [21] together had 67 seats. Therefore, the HSS-HSLS coalition which had 8 seats was instrumental in forming a government.[22] Before the elections, leaders of the coalition stated that they will first speak with the party which wins the most seats (not counting diaspora seats).[22] As this turned out to be HDZ, negotiations between HDZ and HSS-HSLS of a coalition started on 3 December.[23]
Although HSS-HSLS started negotiating with HDZ, the president of SDP Milanović refused to give up and still claimed that SDP was also in a process of forming of a government because SDP, HNS, IDS and SDA won 150 thousand votes more than HDZ (not counting diaspora).[24] HDSSB had declared support for SDP [25] if SDP-formed government will work "in the interest of Slavonia and Baranja",[26] but Milanović stated that he firmly believed that SDP will form the government even without support from HDSSB. Although up until 25 November Ljubo Jurčić still claimed that he was SDP's candidate for premier,[27] on 30 November Milanović announced that he was assuming responsibility for forming SDP-led government. Jurčić confirmed that he thinks that "responsibility for functioning of the government should be distributed among heads of parties and that is the best concept in this circumstances".[28] Heads of HSS-HSLS coalition Adlešič and Friščić declared this decision to be "very important and could influence their decision about who they will support". Adlešić added that Milanović is "much better premier candidate than Jurčić and that SDP would probably have better election results if Milanović made this decision earlier".[29]
On 12 December it was announced that coalition talks between HDZ and the HSS-HSLS were close to completion and the odds of HSS-HSLS entering into discussions with SDP were announced by Božidar Pankretić as very low.[30] Three days later, President Mesić held a second round of consultations with parliamentary parties and was reassured that HDZ and HSS-HSLS are finishing their negotiations. Mesić considered that a proof that Sanader had support of the majority of Sabor and handed him a mandate to form a government.[31] Following that announcement, Milanović again reiterated that SDP still hasn't given up on forming a government. Sanader described this behaviour as "not fitting the democratic standards" and that president would have much easier job if SDP just acknowledged their defeat.[31]
The first session of the newly elected parliament was called for 11 January 2008,[32] and on 12 January, the parliament approved Sanader's cabinet.[33]
| Government | Opposition | |||||||||||||||||||||||||||||||||||||||||||||||||||||||||||||||||||||||||
|---|---|---|---|---|---|---|---|---|---|---|---|---|---|---|---|---|---|---|---|---|---|---|---|---|---|---|---|---|---|---|---|---|---|---|---|---|---|---|---|---|---|---|---|---|---|---|---|---|---|---|---|---|---|---|---|---|---|---|---|---|---|---|---|---|---|---|---|---|---|---|---|---|---|---|
| ||||||||||||||||||||||||||||||||||||||||||||||||||||||||||||||||||||||||||
References
- (in Croatian) President announces elections
- (in Croatian) Law defining electorates
- (in Croatian) Središnji državni ured za upravu: Pravo glasa na parlamentarnim izborima ostvaruje 4 478 386 birača
- (in Croatian) Večernji list: Četiri milijuna građana na izborima Archived 27 November 2007 at the Wayback Machine
- "javno.com: "Official Electoral Results on Dec 11 At Earliest"". Archived from the original on 2 February 2008. Retrieved 27 November 2007.
- (in Croatian) News about electoral lists on Net.hr
- (in Croatian) Announcement regarding electoral lists Archived 27 November 2007 at the Wayback Machine
- "IZBORI 2007". Archived from the original on 2 May 2012. Retrieved 2 November 2007.
- Following parliamentary elections 25 November 2007 in the Croatia will be unconstitutional not free and undemocratically
- "Službeni rezultati izbora za zastupnike u hrvatski Sabor" [Official results of elections of representatives to the Croatian Parliament] (PDF) (in Croatian). State Election Committee. 22 December 2007. Retrieved 8 November 2011.
- (in Croatian) Izlazne ankete: SDP u blagoj prednosti pred HDZ-om
- (in Croatian) HDZ pobijedio
- (in Croatian) Sanader i Milanović 'pobjednici', Mesić odlučuje Archived 10 June 2011 at the Wayback Machine
- (in Croatian) iskon.hr: 'Mandat onome s dokazom o većini u Saboru' Archived 14 September 2012 at Archive.today
- (in Croatian) Mesić: Na mene se vrše pritisci
- (in Croatian) net.hr: I dalje se ne zna ni tko, ni kada
- (in Croatian) net.hr: Zašto Mesić gubi neutralnost?
- (in Croatian) Archived 2 February 2008 at the Wayback Machine
- (in Croatian) Archived 2 February 2008 at the Wayback Machine
- (in Croatian)Election discussions with Croatia president Archived 13 December 2007 at the Wayback Machine
- (in Croatian)SDA has signed deal with SDP Archived 2 February 2008 at the Wayback Machine
- (in Croatian) Koaliciji HSS-HSLS obećana tri ministarstva? Archived 10 June 2011 at the Wayback Machine
- (in Croatian) tportal.hr: 'Bilo bi lakše da smo išli na podjelu fotelja' Archived 10 June 2011 at the Wayback Machine
- (in Croatian)dnevnik.hr: Milanović i Pusić: Imamo zastupnika više od HDZ-a
- (in Croatian)HDSSB is willing to support SDP
- (in Croatian)dnevnik.hr: Šišljagić: Priklonit ćemo se onima koji zajamče razvoj Slavonije i Baranje
- (in Croatian)dnevnik.hr: Jurčić: 'Ja sam budući hrvatski premijer'
- (in Croatian)dnevnik.hr: SDP maknuo Jurčića da privuče HSS-HSLS?
- (in Croatian)dnevnik.hr: Adlešič: Promjena Milanović-Jurčić može utjecati na našu odluku
- "HSS-HSLS to SDP: Last hope is dying". Archived from the original on 13 December 2007. Retrieved 12 December 2007.
- (in Croatian)net.hr: Sanader sastavlja Vladu
- BalkanInsight.com - Croatia's New Parliament Convened
- Croatian parliament approves PM Sanader's cabinet - Boston.com
External links
| Wikimedia Commons has media related to Croatian parliamentary election (2007). |
- 2007 electoral posters
- 2007 Parliamentary election in Croatia site (Official)
- 2007 Croatian Parliamentary election; Croatian radiotelevision site (Unofficial)
- 2007 Croatian Parliamentary election; Croatian People's Party - Liberal Democrats site (Unofficial)
- 2007 Parliamentary election in Croatia site (Unofficial)
- Croatian Parliament (Official)
