2015 Salvadoran legislative election
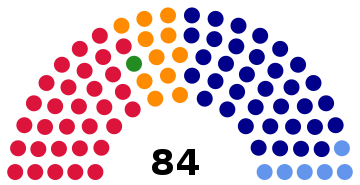
Legislative elections were held in El Salvador on 1 March 2015 to choose 84 members of the Legislative Assembly, 20 members of the Central American Parliament and 262 mayors.
| ||||||||||||||||||||||||||||||||||||||||||||||
All 84 seats in the Legislative Assembly 43 seats needed for a majority | ||||||||||||||||||||||||||||||||||||||||||||||
|---|---|---|---|---|---|---|---|---|---|---|---|---|---|---|---|---|---|---|---|---|---|---|---|---|---|---|---|---|---|---|---|---|---|---|---|---|---|---|---|---|---|---|---|---|---|---|
| Turnout | 48.23% ( | |||||||||||||||||||||||||||||||||||||||||||||
This lists parties that won seats. See the complete results below. | ||||||||||||||||||||||||||||||||||||||||||||||
| ||||||||||||||||||||||||||||||||||||||||||||||
Electoral system
The 84 members of the Legislative Assembly are elected by open list proportional representation from 14 multi-member constituencies based on the departments, with seats allocated using the largest remainder method.
Legislative election
 | ||||
| Party | Votes | % | Seats | |
|---|---|---|---|---|
| Nationalist Republican Alliance | 885,374 | 38.90 | 32 | |
| Farabundo Martí National Liberation Front | 847,289 | 37.23 | 31 | |
| Grand Alliance for National Unity | 209,897 | 9.22 | 11 | |
| National Coalition Party | 154,093 | 6.77 | 4 | |
| Christian Democratic Party | 56,353 | 2.48 | 1 | |
| ARENA–PCN | 37,690 | 1.66 | 3 | |
| Democratic Change | 36,796 | 1.62 | 0 | |
| Salvadoran Democracy | 19,846 | 0.87 | 0 | |
| Social Democratic Party | 16,770 | 0.74 | 0 | |
| PCN–PDC | 6,453 | 0.28 | 1 | |
| PCN–DS | 3,658 | 0.16 | 1 | |
| Independents | 1,802 | 0.08 | 0 | |
| Total | 2,276,021 | 100.00 | 84 | |
| Valid votes | 2,276,021 | 96.09 | ||
| Invalid/blank votes | 92,712 | 3.91 | ||
| Total votes | 2,368,733 | 100.00 | ||
| Registered voters/turnout | 4,911,672 | 48.23 | ||
| Source: TSE | ||||
Central American Parliament
 | |||||
| Party | Votes | % | Seats | +/– | |
|---|---|---|---|---|---|
| Nationalist Republican Alliance | 861,491 | 40.14 | 8 | 0 | |
| Farabundo Martí National Liberation Front | 854,621 | 39.82 | 8 | –1 | |
| Grand Alliance for National Unity | 193,848 | 9.03 | 2 | +2 | |
| National Coalition Party | 124,463 | 5.80 | 1 | –1 | |
| Christian Democratic Party | 45,110 | 2.10 | 1 | 0 | |
| Democratic Change | 29,528 | 1.38 | 0 | 0 | |
| Social Democratic Party | 13,907 | 0.65 | 0 | New | |
| Salvadoran Progressive Party | 12,150 | 0.57 | 0 | New | |
| Salvadoran Patriotic Fraternity | 11,210 | 0.52 | 0 | New | |
| Total | 2,146,328 | 100.00 | 20 | 0 | |
| Valid votes | 2,146,328 | 91.44 | |||
| Invalid/blank votes | 200,843 | 8.56 | |||
| Total votes | 2,347,171 | 100.00 | |||
| Registered voters/turnout | 4,911,672 | 47.79 | |||
| Source: TSE | |||||
Municipal
 | |||||
| Party | Votes | % | Seats | +/– | |
|---|---|---|---|---|---|
| Nationalist Republican Alliance | 944,859 | 39.93 | 129 | +13 | |
| Farabundo Martí National Liberation Front | 892,882 | 37.73 | 85 | –9 | |
| Grand Alliance for National Unity | 244,567 | 10.34 | 19 | +2 | |
| National Coalition Party | 173,438 | 7.33 | 20 | –7 | |
| Christian Democratic Party | 52,729 | 2.23 | 7 | +2 | |
| Democratic Change | 25,099 | 1.06 | 1 | –2 | |
| Democracia Salvadoreña | 13,132 | 0.55 | 0 | New | |
| Social Democratic Party | 9,347 | 0.40 | 1 | New | |
| Salvadoran Progressive Party | 6,552 | 0.28 | 0 | New | |
| Salvadoran Patriotic Fraternity | 3,658 | 0.15 | 0 | 0 | |
| Total | 2,366,263 | 100.00 | 262 | 0 | |
| Valid votes | 2,366,263 | 97.98 | |||
| Invalid/blank votes | 48,790 | 2.02 | |||
| Total votes | 2,415,053 | 100.00 | |||
| Registered voters/turnout | 4,911,672 | 49.17 | |||
| Source: TSE (votes) | |||||
Departmental capitals

References
This article is issued from Wikipedia. The text is licensed under Creative Commons - Attribution - Sharealike. Additional terms may apply for the media files.