Call graph
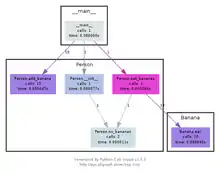
A call graph (also known as a call multigraph[1][2]) is a control flow graph,[3] which represents calling relationships between subroutines in a computer program. Each node represents a procedure and each edge (f, g) indicates that procedure f calls procedure g. Thus, a cycle in the graph indicates recursive procedure calls.

Basic concepts
Call graphs can be dynamic or static.[4] A dynamic call graph is a record of an execution of the program, for example as output by a profiler. Thus, a dynamic call graph can be exact, but only describes one run of the program. A static call graph is a call graph intended to represent every possible run of the program. The exact static call graph is an undecidable problem, so static call graph algorithms are generally overapproximations. That is, every call relationship that occurs is represented in the graph, and possibly also some call relationships that would never occur in actual runs of the program.
Call graphs can be defined to represent varying degrees of precision. A more precise call graph more precisely approximates the behavior of the real program, at the cost of taking longer to compute and more memory to store. The most precise call graph is fully context-sensitive, which means that for each procedure, the graph contains a separate node for each call stack that procedure can be activated with. A fully context-sensitive call graph is called a calling context tree. This can be computed dynamically easily, although it may take up a large amount of memory. Calling context trees are usually not computed statically, because it would take too long for a large program. The least precise call graph is context-insensitive, which means that there is only one node for each procedure.
With languages that feature dynamic dispatch, such as Java and C++, computing a static call graph precisely requires alias analysis results.[5] Conversely, computing precise aliasing requires a call graph. Many static analysis systems solve the apparent infinite regress by computing both simultaneously.
Usages
Call graphs can be used in different ways. One simple application of call graphs is finding procedures that are never called. Call graphs can act as documentation for humans to understand programs.[6] They can also serve as basis for further analyses, such as an analysis that tracks the flow of values between procedures, or change impact prediction.[7] Call graphs can also be used to detect anomalies of program execution or code injection attacks.[8]
Software
Free software call-graph generators
- Run-time call-graph (most of tools listed are profilers with callgraph functionality)
- gprof : included in BSD or part of the GNU Binary Utilities
- callgrind : part of Valgrind
- KCachegrind : powerful tool to generate and analyze call graphs based on data generated by callgrind
- Mac OS X Activity Monitor : Apple GUI process monitor Activity Monitor has a built-in call graph generator that can sample processes and return a call graph. This function is only available in Mac OS X Leopard
- OpenPAT : includes the
control_flowtool which automatically creates a Graphviz call-graph picture from runtime measurements. - pprof, open source tool for visualization and analysis of profile data, to be used in conjunction with gperftools.
- CodeAnalyst from AMD (released under GPL)
- makeppgraph is a dependency graph generator (at module level) for builds performed with makepp.
- Intel(R) Single Event API (free, open-source)
- Static (for C language), for getting call graphs without running application
- doxygen : Uses graphviz to generate static call/inheritance diagrams
- cflow : GNU cflow is able to generate the direct and inverted call graph of a C program
- egypt : a small Perl script that uses gcc and Graphviz to generate the static call graph of a C program.
- Analizo: calculates source code metrics, generates dependency graphs.
- CCTree : Native Vim plugin that can display static call graphs by reading a cscope database. Works for C programs.
- codeviz : a static call graph generator (the program is not run). Implemented as a patch to gcc; works for C and C++ programs.
- calltree.sh : Bash shell functions that glue together cscope, graphviz, and a sampling of dot-rendering tools to display "caller" and "callee" relationships above, below, and/or between the C functions you specify.
- tceetree : like calltree.sh, it connects Cscope and Graphviz, but it is an executable rather than a bash script.
- Go
- go-callvis : an interactive call graph generator for Go programs whose output can be drawn with Graphviz
- .Net
- NDepend :is a static analysis tool for .Net code. This tool supports a large number of code metrics, allows for visualization of dependencies using directed graphs and dependency matrix.
- PHP, Perl and Python
- Devel::NYTProf : a perl performance analyser and call chart generator
- phpCallGraph : a call graph generator for PHP programs that uses Graphviz. It is written in PHP and requires at least PHP 5.2.
- pycallgraph : a call graph generator for Python programs that uses Graphviz.
- pyan : a static call graph generator for Python programs that uses Graphviz.
- gprof2dot : A call graph generator written in Python that converts profiling data for many languages/runtimes to a Graphviz callgraph.
- code2flow: A call graph generator for Python and Javascript programs that uses Graphviz
- rcviz : Python module for rendering runtime-generated call graphs with Graphviz. Each node represents an invocation of a function with the parameters passed to it and the return value.
- XQuery
- XQuery Call Graphs from the XQuery Wikibook: A call graph generator for an XQuery function module that uses Graphviz
Proprietary call-graph generators
- Project Analyzer
- Static code analyzer and call graph generator for Visual Basic code
- Visual Expert
- Static code analyzer and call graph generator for Oracle PL/SQL, SQLServer Transact-SQL, C# and PowerBuilder code
- Intel VTune Performance Analyzer
- Instrumenting profiler to show call graph and execution statistics
- DMS Software Reengineering Toolkit
- Customizable program analysis tool with static whole-program global call graph extraction for C, Java and COBOL
Other, related tools
- Graphviz
- Turns a text representation of any graph (including a call graph) into a picture.
Sample graph
A sample call graph generated from gprof analyzing itself:
index    called     name                              |index    called     name
      72384/72384       sym_id_parse [54]             |       1508/1508        cg_dfn [15]
[3]   72384             match [3]                     |[13]   1508             pre_visit [13]
----------------------                                |----------------------
          4/9052        cg_tally [32]                 |       1508/1508        cg_assemble [38]
       3016/9052        hist_print [49]               |[14]   1508             propagate_time [14]
       6032/9052        propagate_flags [52]          |----------------------
[4]    9052             sym_lookup [4]                |          2             cg_dfn [15]
----------------------                                |       1507/1507        cg_assemble [38]
       5766/5766        core_create_function_syms [41]|[15]   1507+2           cg_dfn [15]
[5]    5766             core_sym_class [5]            |       1509/1509        is_numbered [9]
----------------------                                |       1508/1508        is_busy [11]
         24/1537        parse_spec [19]               |       1508/1508        pre_visit [13]
       1513/1537        core_create_function_syms [41]|       1508/1508        post_visit [12]
[6]    1537             sym_init [6]                  |          2             cg_dfn [15]
----------------------                                |----------------------
       1511/1511        core_create_function_syms [41]|       1505/1505        hist_print [49]
[7]    1511             get_src_info [7]              |[16]   1505             print_line [16]
----------------------                                |          2/9           print_name_only [25]
          2/1510        arc_add [31]                  |----------------------
       1508/1510        cg_assemble [38]              |       1430/1430        core_create_function_syms [41]
[8]    1510             arc_lookup [8]                |[17]   1430             source_file_lookup_path [17]
----------------------                                |----------------------
       1509/1509        cg_dfn [15]                   |         24/24          sym_id_parse [54]
[9]    1509             is_numbered [9]               |[18]     24             parse_id [18]
----------------------                                |         24/24          parse_spec [19]
       1508/1508        propagate_flags [52]          |----------------------
[10]   1508             inherit_flags [10]            |         24/24          parse_id [18]
----------------------                                |[19]     24             parse_spec [19]
       1508/1508        cg_dfn [15]                   |         24/1537        sym_init [6]
[11]   1508             is_busy [11]                  |----------------------
----------------------                                |         24/24          main [1210]
       1508/1508        cg_dfn [15]                   |[20]     24             sym_id_add [20]
[12]   1508             post_visit [12]               |
See also
References
- Callahan, D.; Carle, A.; Hall, M.W.; Kennedy, K. (April 1990). "Constructing the procedure call multigraph". IEEE Transactions on Software Engineering. 16 (4): 483–487. doi:10.1109/32.54302.
- Uday Khedker; Amitabha Sanyal; Bageshri Sathe (2009). Data Flow Analysis: Theory and Practice. CRC Press. p. 234. ISBN 978-0-8493-3251-7.
- Pankaj Jalote (1997). An Integrated Approach to Software Engineering. Springer Science & Business Media. p. 372. ISBN 978-0-387-94899-7.
- Ryder, B.G. (May 1979). "Constructing the Call Graph of a Program". IEEE Transactions on Software Engineering. SE-5 (3): 216–226. doi:10.1109/tse.1979.234183.
- Grove, David; DeFouw, Greg; Dean, Jeffrey; Chambers, Craig; Grove, David; DeFouw, Greg; Dean, Jeffrey; Chambers, Craig (9 October 1997). "Call graph construction in object-oriented languages". ACM SIGPLAN Notices. ACM. 32 (10): 108, 108–124, 124. doi:10.1145/263700.264352.
- Eisenbarth, T.; Koschke, R.; Simon, D. (2001). "Aiding program comprehension by static and dynamic feature analysis". Proceedings IEEE International Conference on Software Maintenance. ICSM 2001: 602–611. doi:10.1109/icsm.2001.972777. ISBN 0-7695-1189-9.
- Musco, Vincenzo; Monperrus, Martin; Preux, Philippe (26 July 2016). "A large-scale study of call graph-based impact prediction using mutation testing". Software Quality Journal. 25 (3): 921–950. arXiv:1812.06286. doi:10.1007/s11219-016-9332-8.
- Gao, Debin; Reiter, Michael K.; Song, Dawn (25 October 2004). "Gray-box extraction of execution graphs for anomaly detection". Proceedings of the 11th ACM conference on Computer and communications security - CCS '04. ACM. pp. 318–329. doi:10.1145/1030083.1030126. ISBN 1581139616.
