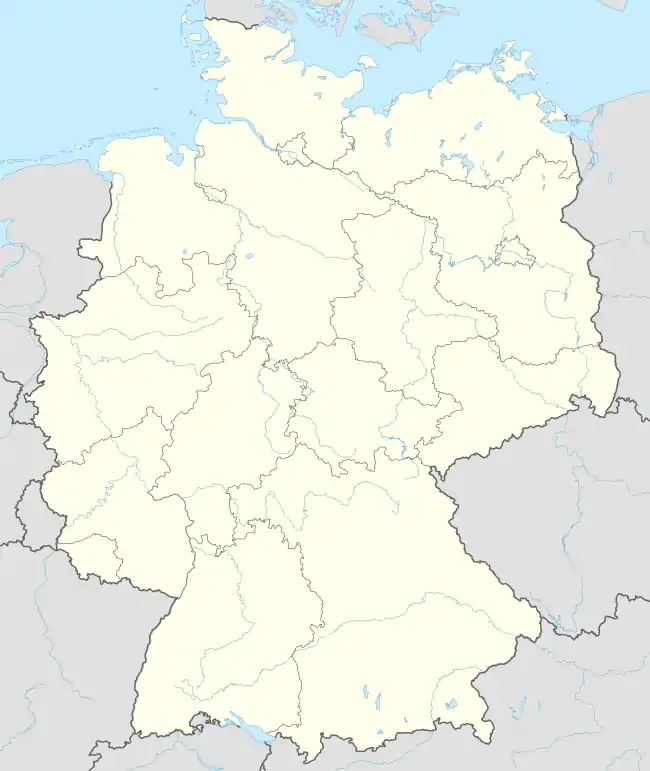
Cumlosen
Cumlosen is a municipality in the Prignitz district, in Brandenburg, Germany.
Cumlosen | |
|---|---|
Location of Cumlosen within Prignitz district 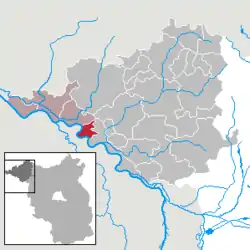 | |
 Cumlosen 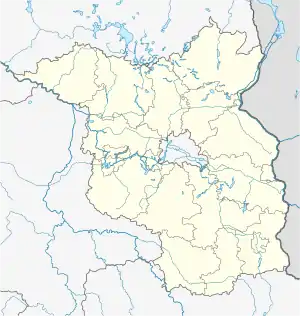 Cumlosen | |
| Coordinates: 53°01′59″N 11°40′00″E | |
| Country | Germany |
| State | Brandenburg |
| District | Prignitz |
| Municipal assoc. | Lenzen-Elbtalaue |
| Subdivisions | 3 Ortsteile |
| Government | |
| • Mayor | Harald Pohle (UBC) |
| Area | |
| • Total | 21.85 km2 (8.44 sq mi) |
| Elevation | 20 m (70 ft) |
| Population (2019-12-31)[1] | |
| • Total | 727 |
| • Density | 33/km2 (86/sq mi) |
| Time zone | UTC+01:00 (CET) |
| • Summer (DST) | UTC+02:00 (CEST) |
| Postal codes | 19322 |
| Dialling codes | 038794 |
| Vehicle registration | PR |
| Website | www.cumlosen.de |
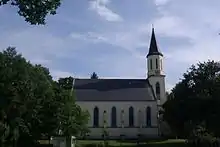
The church
History
Between 1945 and 1990 Cumlosen served as East German inner German border crossing for inland navigation on the Elbe. The crossing was open for freight vessels navigating between Czechoslovakia, the Soviet Zone of occupation in Germany (till 1949, thereafter the East German Democratic Republic, or West Berlin and the British zone of occupation (till 1949) and thereafter the West German Federal Republic of Germany. The traffic was subject to the Interzonal traffic regulations and that between West Germany and West Berlin was subject to the special regulations of the Transit Agreement (1972).
Demography
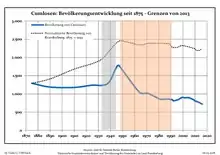
Development of Population since 1875 within the Current Boundaries (Blue Line: Population; Dotted Line: Comparison to Population Development of Brandenburg state; Grey Background: Time of Nazi rule; Red Background: Time of Communist rule)
|
|
References
- "Bevölkerung im Land Brandenburg nach amtsfreien Gemeinden, Ämtern und Gemeinden 31. Dezember 2019". Amt für Statistik Berlin-Brandenburg (in German). July 2020.
- Detailed data sources are to be found in the Wikimedia Commons.Population Projection Brandenburg at Wikimedia Commons
Towns and municipalities in Prignitz | ||
|---|---|---|
Coat of Arms of Prignitz district | ||
This article is issued from Wikipedia. The text is licensed under Creative Commons - Attribution - Sharealike. Additional terms may apply for the media files.