Dadeldhura
Dadeldhura is a far-western district of Nepal. It lies in the Mahakali Zone of far-western Nepal. The region has a desert-mountainous landscape that contains many local religious temples like ugratara temple. The district is frequently visited by tourists to Nepal, but contains local routes to Mt. Kailaish in Tibet, Rara lake in Humla district and the last remaining remnants of the Far Western Malla Kingdom. Nagi Malla was the last royal to live here before Nepalese invasion in 1790.
Dadeldhura
डडेलधुरा Amaragadhi | |
|---|---|
| Dadeldhura | |
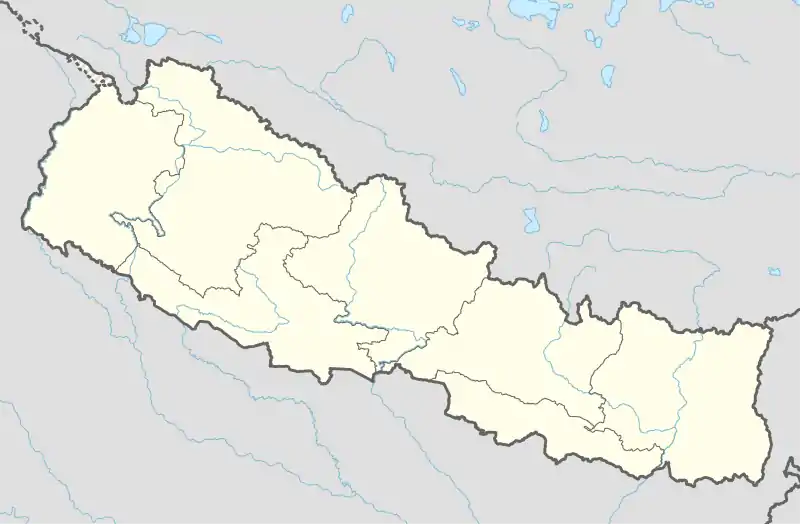 Dadeldhura Location in Nepal | |
| Coordinates: 29°18′0″N 80°35′0″E | |
| Country | |
| Zone | Mahakali Zone |
| District | Dadeldhura District |
| Government | |
| Elevation | 1,745 m (5,725 ft) |
| Population (2011) | |
| • Total | 22,241 |
| Time zone | UTC+5:45 (Nepal Time) |
The spoken language is Doteli and the majority of inhabitants are Hindu. The district is growing faster and modernization is on rapid speed. The largest city is Dadheldura city. The population in 2011 is 142094 and in 1991 it was 3,930.
Climate
The highest temperature ever recorded in Dadeldhura was 34.3 °C (93.7 °F) on June 20, 2012, while the lowest temperature ever recorded was −5.0 °C (23.0 °F) in January 2008.[1]
| Climate data for Dadeldhura, 1980-2010 normals, extremes 1978-present | |||||||||||||
|---|---|---|---|---|---|---|---|---|---|---|---|---|---|
| Month | Jan | Feb | Mar | Apr | May | Jun | Jul | Aug | Sep | Oct | Nov | Dec | Year |
| Record high °C (°F) | 25.5 (77.9) |
25.5 (77.9) |
33.3 (91.9) |
33.5 (92.3) |
32.3 (90.1) |
34.3 (93.7) |
32.4 (90.3) |
30.1 (86.2) |
28.5 (83.3) |
28.8 (83.8) |
25.0 (77.0) |
25.0 (77.0) |
34.3 (93.7) |
| Average high °C (°F) | 14.0 (57.2) |
15.2 (59.4) |
19.4 (66.9) |
23.6 (74.5) |
26.1 (79.0) |
26.0 (78.8) |
24.2 (75.6) |
23.8 (74.8) |
23.3 (73.9) |
21.7 (71.1) |
18.5 (65.3) |
15.7 (60.3) |
20.6 (69.1) |
| Daily mean °C (°F) | 9.0 (48.2) |
10.2 (50.4) |
14.0 (57.2) |
18.0 (64.4) |
20.3 (68.5) |
21.3 (70.3) |
20.7 (69.3) |
20.4 (68.7) |
19.4 (66.9) |
16.7 (62.1) |
13.2 (55.8) |
10.5 (50.9) |
15.7 (60.3) |
| Average low °C (°F) | 4.1 (39.4) |
5.1 (41.2) |
8.6 (47.5) |
12.3 (54.1) |
14.5 (58.1) |
16.6 (61.9) |
17.3 (63.1) |
17.1 (62.8) |
15.5 (59.9) |
11.7 (53.1) |
8.0 (46.4) |
5.3 (41.5) |
10.8 (51.4) |
| Record low °C (°F) | −5.0 (23.0) |
−2.5 (27.5) |
−1.0 (30.2) |
3.0 (37.4) |
6.8 (44.2) |
7.8 (46.0) |
8.0 (46.4) |
10.8 (51.4) |
10.6 (51.1) |
1.4 (34.5) |
3.0 (37.4) |
−4.2 (24.4) |
−5.0 (23.0) |
| Average precipitation mm (inches) | 42.8 (1.69) |
62.5 (2.46) |
56.8 (2.24) |
55.1 (2.17) |
92.2 (3.63) |
171.6 (6.76) |
329.2 (12.96) |
315.9 (12.44) |
196.0 (7.72) |
44.3 (1.74) |
9.4 (0.37) |
23.0 (0.91) |
1,398.8 (55.09) |
| Source: Department Of Hydrology and Meteorology[2] | |||||||||||||
References
- "Extremes Temperatures January" (PDF). Retrieved 3 February 2021.
- "Climate Files". Department Of Hydrology and Meteorology. Retrieved 3 February 2021.
External links
- UN map of the municipalities of Dadeldhura District
- http://curis.ku.dk/ws/files/20497354/de2_001.pdf
Headquarters: Amargadhi | ||
| Municipalities | 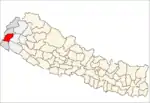 | |
| Rural municipalities | ||
| Former VDCs | ||
List of municipalities and rural municipalities of Nepal | ||