Dartmouth East
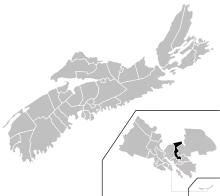
Dartmouth East is a provincial electoral district in Nova Scotia, Canada, that elects one member of the Nova Scotia House of Assembly. The riding is located in the Dartmouth region of the Halifax RM.
 | |||
| Provincial electoral district | |||
| Legislature | Nova Scotia House of Assembly | ||
| MLA |
Progressive Conservative | ||
| District created | 1978 | ||
| Last contested | 2017 | ||
| Demographics | |||
| Population (2016[1]) | 23,264 | ||
| Electors | 13,788 | ||
| Area (km²) | 20.00 | ||
| Pop. density (per km²) | 1,163.2 | ||
| Census division(s) | Halifax RM | ||
| Census subdivision(s) | Halifax RM | ||
In 1978, the district was created to provide for an increase in representation of six members and in 2003, it lost a northern area to Waverley-Fall River and gained an area in Woodlawn. In 2013, following the recommendations of the Electoral Boundaries Commission report, it gained the Montebello area from Waverley-Fall River-Beaver Bank and lost the area east of Bell Lake to Cole Harbour-Portland Valley and lost the area north of Main Street and east of Caledonia Road until Geovex Court to Preston-Dartmouth.[2]
Members of the Legislative Assembly
This riding has elected the following Members of the Legislative Assembly:
| Legislature | Years | Member | Party | |
|---|---|---|---|---|
| 63rd | 2017–present | Tim Halman | Progressive Conservative | |
| 62nd | 2015-2017 | Andrew Younger | Independent | |
| 2013-2015 | Liberal | |||
| 61st | 2009–2013 | |||
| 60th | 2006–2009 | Joan Massey | New Democratic | |
| 59th | 2003–2006 | |||
| 58th | 1999–2003 | Jim Smith | Liberal | |
| 57th | 1998–1999 | |||
| 56th | 1993–1998 | |||
| 55th | 1988–1993 | |||
| 54th | 1984–1988 | |||
| 53rd | 1981–1984 | Richard L. Weldon | Progressive Conservative | |
| 52nd | 1978–1981 | |||
Election results
| 2017 Nova Scotia general election | ||||||||
|---|---|---|---|---|---|---|---|---|
| Party | Candidate | Votes | % | ±% | ||||
| Progressive Conservative | Tim Halman | 3,309 | 41.5 | +27.87% | ||||
| Liberal | Edgar Burns | 3,118 | 37.9 | -25.95% | ||||
| New Democratic | Bill McEwen | 9,64 | 12.2 | -10.32% | ||||
| Green | Matthew Richey | 650 | 8.4 | +8.4% | ||||
| Total valid votes | 8,041 | 100.0 | ||||||
| Total rejected ballots | 52 | 0.64 | ||||||
| Turnout | 8,093 | 54.84 | ||||||
| Eligible voters | 14,758 | |||||||
| Party | Candidate | Votes | % | ±% | |
|---|---|---|---|---|---|
| Liberal | Andrew Younger | 5,469 | 63.85 | +18.76 | |
| New Democratic Party | Deborah M. Stover | 1,929 | 22.52 | -20.69 | |
| Progressive Conservative | Mike M. MacDonnell | 1,167 | 13.63 | +3.97 | |
| Party | Candidate | Votes | % | ±% | |
|---|---|---|---|---|---|
| Liberal | Andrew Younger | 4,073 | 45.09 | +24.26 | |
| New Democratic Party | Joan Massey | 3,903 | 43.21 | -0.01 | |
| Progressive Conservative | Bert Thompson | 873 | 9.66 | -23.61 | |
| Green | Anna Mukpo | 184 | 2.04 | -0.65 | |
| Party | Candidate | Votes | % | ±% | |
|---|---|---|---|---|---|
| New Democratic Party | Joan Massey | 3,822 | 43.22 | +4.49 | |
| Progressive Conservative | Jim Cormier | 2,942 | 33.27 | -3.51 | |
| Liberal | Tracey Devereaux | 1,842 | 20.83 | -0.97 | |
| Green | Elizabeth Perry | 238 | 2.69 | – | |
| Party | Candidate | Votes | % | ±% | |
|---|---|---|---|---|---|
| New Democratic Party | Joan Massey | 3,272 | 38.73 | +10.18 | |
| Progressive Conservative | Terry Degen | 3,107 | 36.78 | +2.72 | |
| Liberal | Debra Barlow | 1,842 | 21.80 | -15.59 | |
| Marijuana | Hugô St-Onge | 101 | 1.20 | ||
| Nova Scotia Party | Scott Anderson | 98 | 1.16 | ||
| Independent | Sebastien Theriault | 28 | 0.33 | ||
| Party | Candidate | Votes | % | ±% | |
|---|---|---|---|---|---|
| Liberal | Jim Smith | 2,975 | 37.39 | ||
| Progressive Conservative | Terry Degen | 2,710 | 34.06 | ||
| New Democratic Party | Heather Henderson | 2,272 | 28.55 | ||
| Party | Candidate | Votes | % | ±% | |
|---|---|---|---|---|---|
| Liberal | Jim Smith | 3,326 | 40.9 | ||
| New Democratic Party | Viola Huntington | 2,954 | 36.3 | ||
| Progressive Conservative | Ralph Hawley | 1,849 | 22.7 | ||
| Party | Candidate | Votes | % | ±% | |
|---|---|---|---|---|---|
| Liberal | Jim Smith | 4,912 | |||
| Progressive Conservative | Gwen Haliburton | 2,429 | |||
| New Democratic Party | Owen Hertzman | 1,504 | |||
| Party | Candidate | Votes | % | ±% | |
|---|---|---|---|---|---|
| Liberal | Jim Smith | 5,193 | |||
| Progressive Conservative | Jack Greenough | 4,940 | |||
| New Democratic Party | Maureen Vine | 1,950 | |||
| Party | Candidate | Votes | % | ±% | |
|---|---|---|---|---|---|
| Liberal | Jim Smith | 4,004 | |||
| Progressive Conservative | Richard Weldon | 3,101 | |||
| New Democratic Party | Gerry Legere | 2,058 | |||
| Party | Candidate | Votes | % | ±% | |
|---|---|---|---|---|---|
| Progressive Conservative | Richard Weldon | 4,253 | |||
| Liberal | Jim Smith | 3,351 | |||
| New Democratic Party | Gerry Legere | 2,400 | |||
| Party | Candidate | Votes | % | ±% | |
|---|---|---|---|---|---|
| Progressive Conservative | Richard Weldon | 5,098 | |||
| Liberal | Barbara Hart | 3,488 | |||
| New Democratic Party | Gabriel Des Rochers | 1,030 | |||
References
- "Finding a Primary Care Provider in Nova Scotia; August 2019 Report" (PDF). nshealth.ca. Nova Scotia Health Authority. Retrieved 17 March 2020.
- Dartmouth East - Constituency History Nova Scotia Legislature