DataGraph
DataGraph is a graphing and data analysis software application for the macOS operating system, developed by Visual Data Tools in Chapel Hill, NC. DataGraph is used for creating publication quality graphics, particularly for research and science.[1][2]
| Developer(s) | Visual Data Tools, Inc. |
|---|---|
| Initial release | 2006 |
| Stable release | 4.6
/ 14 October 2020 |
| Operating system | macOS |
| Type | Graphing software |
| Website | visualdatatools |
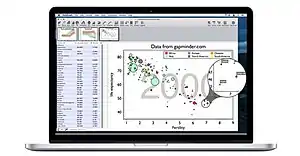 DataGraph user interface with data inspection tool. |
Visual Data Tools was founded in 2002. In 2005, Visual Data Tools was awarded an Apple Design award for the Best Mac OS X Scientific Computing Solution for DataTank.[3] In 2006, Visual Data Tools released DataGraph, initially called DataPlot.[4] In 2011, DataGraph was among the first applications available on the mac App store.[5]
Both DataTank and DataGraph were created by David Adalsteinsson,[4] a Professor of Mathematics at the University of North Carolina at Chapel Hill.[6]
References
- MacAskill, Michael R. (2012). "DataGraph 3.0". Journal of Statistical Software. doi:10.18637/jss.v047.s02.
- Ooi, Jesslynn; Traini, Daniela; Young, Paul M (March 2014). "Graphing software for medical writers". Medical Writing. 23 (1): 41–44. doi:10.1179/2047480613Z.000000000185.
- Cohen, Peter (June 9, 2005). "WWDC: Apple Design Award 2005 winners announced". Macworld.
- Swain, Chris. "Application Review: DataGraph (formally known is DataPlot)". Macs in Chemistry.
- "Visual Data Tools, Inc. Announces the Mac App Store Release of DataGraph, an Innovative and Powerful Graphing Application for Mac OSX". Benzinga. 6 January 2011. Retrieved 28 August 2020.
- "Adalsteinsson, David, Department of Mathematics". math.unc.edu.
This article is issued from Wikipedia. The text is licensed under Creative Commons - Attribution - Sharealike. Additional terms may apply for the media files.
