Demand curve
In economics, a demand curve is a graph depicting the relationship between the price of a certain commodity (the y-axis) and the quantity of that commodity that is demanded at that price (the x-axis). Demand curves may be used to model the price-quantity relationship for an individual consumer (an individual demand curve), or more commonly for all consumers in a particular market (a market demand curve).

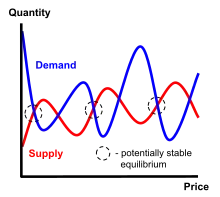
It has generally been assumed that demand curves are downward-sloping, as shown in the adjacent image. This is because of the law of demand: for most goods, the quantity demanded will decrease in response to an increase in price, and will increase in response to a decrease in price.[1] There are certain goods which do not follow this law. These include Veblen goods, Giffen goods, stock exchanges and expectations of future price changes. The Sonnenschein–Mantel–Debreu theorem describes the shape that a market demand curve can take more precisely.
Demand curves are used to estimate behaviors in competitive markets, and are often combined with supply curves to estimate the equilibrium price (the price at which sellers together are willing to sell the same amount as buyers together are willing to buy, also known as market clearing price) and the equilibrium quantity (the amount of that good or service that will be produced and bought without surplus/excess supply or shortage/excess demand) of that market.[1]:57 In a monopolistic market, the demand curve facing the monopolist is simply the market demand curve.
Movement along the demand curve is when the commodity experience change in both the quantity demanded and price, causing the curve to move in a specific direction. The shift in the demand curve is when, the price of the commodity remains constant, but there is a change in quantity demanded due to some other factors, causing the curve to shift to a particular side. [2]
Demand curves are estimated by a variety of techniques.[3] The usual method is to collect data on past prices, quantities, and variables such as consumer income and product quality that affect demand and apply statistical methods, variants on multiple regression. Consumer surveys and experiments are alternative sources of data. For the shapes of a variety of goods' demand curves, see the article price elasticity of demand.
Shape of the demand curve
Demand curves are often graphed as straight lines, where a and b are parameters:
- .

The constant a embodies the effects of all factors other than price that affect demand. If income were to change, for example, the effect of the change would be represented by a change in the value of "a" and be reflected graphically as a shift of the demand curve. The constant b is the slope of the demand curve and shows how the price of the good affects the quantity demanded.[4]
The graph of the demand curve uses the inverse demand function in which price is expressed as a function of quantity. The standard form of the demand equation can be converted to the inverse equation by solving for P:
- .[4]

Shift of a demand curve
The shift of a demand curve takes place when there is a change in any non-price determinant of demand, resulting in a new demand curve.[5] Non-price determinants of demand are those things that will cause demand to change even if prices remain the same—in other words, the things whose changes might cause a consumer to buy more or less of a good even if the good's own price remained unchanged.[6]
Some of the more important factors are the prices of related goods (both substitutes and complements), income, population, and expectations. However, demand is the willingness and ability of a consumer to purchase a good under the prevailing circumstances; so, any circumstance that affects the consumer's willingness or ability to buy the good or service in question can be a non-price determinant of demand. As an example, weather could be a factor in the demand for beer at a baseball game.
When income increases, the demand curve for normal goods shifts outward as more will be demanded at all prices, while the demand curve for inferior goods shifts inward due to the increased attainability of superior substitutes. With respect to related goods, when the price of a good (e.g. a hamburger) rises, the demand curve for substitute goods (e.g. chicken) shifts out, while the demand curve for complementary goods (e.g. ketchup) shifts in (i.e. there is more demand for substitute goods as they become more attractive in terms of value for money, while demand for complementary goods contracts in response to the contraction of quantity demanded of the underlying good).[5]
Factors affecting individual demand
- Changes in the prices of related goods (substitutes and complements)
- Changes in disposable income, the magnitude of the shift also being related to the income elasticity of demand.
- Changes in tastes and preferences. Tastes and preferences are assumed to be fixed in the short-run. This assumption of fixed preferences is a necessary condition for aggregation of individual demand curves to derive market demand.
- Changes in expectations.[1]:61–62
Factors affecting market demand
In addition to the factors which can affect individual demand there are three factors that can cause the market demand curve to shift:
- a change in the number of consumers,
- a change in the distribution of tastes among consumers,
- a change in the distribution of income among consumers with different tastes.[7]
Some circumstances which can cause the demand curve to shift in include:
- Decrease in price of a substitute
- Increase in price of a complement
- Decrease in income if good is normal good
- Increase in income if good is inferior good
Movement along a demand curve
There is movement along a demand curve when a change in price causes the quantity demanded to change.[5] It is important to distinguish between movement along a demand curve, and a shift in a demand curve. Movements along a demand curve happen only when the price of the good changes.[8] When a non-price determinant of demand changes, the curve shifts. These "other variables" are part of the demand function. They are "merely lumped into intercept term of a simple linear demand function."[8] Thus a change in a non-price determinant of demand is reflected in a change in the x-intercept causing the curve to shift along the x axis.[9]
Price elasticity of demand (PED)
PED is a measure of the sensitivity of the quantity variable, Q, to changes in the price variable, P. Elasticity answers the question of how much the quantity will change in percentage terms for a 1% change in the price, and is thus important in determining how revenue will change. PED is negative because of the inverse relationship between the price of a good and the quantity of the good demanded, a consequence of the law of demand.
The elasticity of demand indicates how sensitive the demand for a good is to a price change. If the absolute value of PED is between zero and 1, demand is said to be inelastic; if the absolute value of PED equals 1, the demand is unitary elastic; and if the absolute value of Price elasticity of demand is greater than 1, demand is elastic. A low coefficient implies that changes in price have little influence on demand. A high elasticity indicates that consumers will respond to a price rise by buying a lot less of the good and that consumers will respond to a price cut by buying a lot more...
Taxes and subsidies
A sales tax on the commodity does not directly change the demand curve, if the price axis in the graph represents the price including tax. Similarly, a subsidy on the commodity does not directly change the demand curve, if the price axis in the graph represents the price after deduction of the subsidy.
If the price axis in the graph represents the price before addition of tax and/or subtraction of subsidy then the demand curve moves inward when a tax is introduced, and outward when a subsidy is introduced.
Derived Demand
The demand for goods can be further divorced into the demand markets for final and intermediate goods. An intermediate good is a good utilized in the process of creating another good, effectively named the final good.[10] It is important to note that the cooperation of several inputs in many circumstances yields a final good and thus the demand for these goods is derived from the demand of the final product; this concept is known as derived demand.[11] The relationship between the intermediate goods and the final good is direct and positive as demand for a final product increases demand for the intermediate goods used to make it.
In order to construct a derived demand curve, specific assumptions must be made and values held constant. The supply curves for other inputs, demand curve for the final good, and production conditions must all be held constant to ascertain an effective derived demand curve. [11]
See also
| Wikimedia Commons has media related to Supply and demand curves. |
References
- Krugman, Paul; Wells, Robin; Graddy, Kathryn (2007). Economics: European Edition. Palgrave Macmillan. ISBN 978-0-7167-9956-6.
- "Demand Curve Shifts".
- Samia Rekhi. "Empirical Estimation of Demand: Top 10 Techniques". economicsdiscussion.net. Retrieved 11 December 2020.
- Besanko; Braeutigam (2005). Microeconomics. Hoboken: Wiley. p. 91. ISBN 0-471-45769-8.
- Case, K. E.; Fair, R. C. (1994). "Demand, Supply, and Market Equilibrium". Principles of Economics (3rd ed.). Englewood Cliffs, New Jersey: Prentice Hall. ISBN 0-13-039950-7.
- "Demand and Supply". www.harpercollege.edu.
- Binger, B.; Hoffman, E. (1998). Microeconomics with Calculus (2nd ed.). Addison-Wesley. ISBN 0-321-01225-9.
A change in relative price changes the distribution of income which in turn changes the demand curve
- Underwood, Instructor's Manual, Microeconomics 5th ed. (Prentice-Hall 2001) at 5.
- The x intercept is affected because the standard diagram uses the inverse demand function
- Kenton, Will. "Understanding Intermediate Goods". Investopedia. Retrieved 2020-12-01.
- Whitaker, John K. (2008), Palgrave Macmillan (ed.), "Derived Demand", The New Palgrave Dictionary of Economics, London: Palgrave Macmillan UK, pp. 1–3, doi:10.1057/978-1-349-95121-5_97-2, ISBN 978-1-349-95121-5, retrieved 2020-12-01