Oligopoly
An oligopoly (ολιγοπώλιο) (Greek: ὀλίγοι πωλητές "few authorities") is a market form wherein a market or industry is dominated by a small group of large sellers (oligopolists). Oligopolies can result from various forms of collusion that reduce market competition which then leads to higher prices for consumers and lower wages for the employees of oligopolies. Oligopolies have their own market structure.[1]
| Competition law |
|---|
 |
| Basic concepts |
| Anti-competitive practices |
| Enforcement authorities and organizations |
With few sellers, each oligopolist is likely to be aware of the actions of the others. According to game theory, the decisions of one firm therefore influence and are influenced by decisions of other firms. Strategic planning by oligopolists needs to take into account the likely responses of the other market participants. Entry barriers include high investment requirements, strong consumer loyalty for existing brands and economies of scale. In developed economies oligopolies dominate the economy as the perfectly competitive model is of negligible importance for consumers. Oligopolies differ from price takers in that they do not have a supply curve. Instead, they search for the best price-output combination.[2]
| one | few | |
| sellers | monopoly | oligopoly |
| buyers | monopsony | oligopsony |
Description
Oligopoly is a common market form where only a limited number of firms are in competition on the supply side. As a quantitative description of oligopoly, the four-firm concentration ratio is often utilized. This measure expresses, as a percentage, the market share of the four largest firms in any particular industry. For example, as of fourth quarter 2008, if we combine total market share of Verizon Wireless, AT&T, Sprint, and T-Mobile, we see that these firms, together, control 97% of the U.S. cellular telephone market.
Oligopolistic competition can give rise to both wide-ranging and diverse outcomes. In some situations, particular companies may employ restrictive trade practices (collusion, market sharing etc.) in order to inflate prices and restrict production in much the same way that a monopoly does. Whenever there is a formal agreement for such collusion, between companies that usually compete with one another, this practice is known as a cartel. A prime example of such a cartel is OPEC, which has a profound influence on the international price of oil.
There are legal restrictions on such collusion in most countries. There does not have to be a formal agreement for collusion to take place (although for the act to be illegal there must be actual communication between companies)–for example, in some industries there may be an acknowledged market leader which informally sets prices to which other producers respond, known as price leadership.
In other situations, competition between sellers in an oligopoly can be fierce, with relatively low prices and high production. This could lead to an efficient outcome approaching perfect competition. The competition in an oligopoly can be greater when there are more firms in an industry than if, for example, the firms were only regionally based and did not compete directly with each other.
Thus the welfare analysis of oligopolies is sensitive to the parameter values used to define the market's structure. In particular, the level of dead weight loss is hard to measure. The study of product differentiation indicates that oligopolies might also create excessive levels of differentiation in order to stifle competition.
Oligopoly theory makes heavy use of game theory to model the behavior of oligopolies:
- Stackelberg's duopoly. In this model, the firms move sequentially (see Stackelberg competition).
- Cournot's duopoly. In this model, the firms simultaneously choose quantities (see Cournot competition).
- Bertrand's oligopoly. In this model, the firms simultaneously choose prices (see Bertrand competition).
Characteristics
- Profit maximization conditions
- An oligopoly maximizes profits.
- Ability to set price
- Oligopolies are price setters rather than price takers.[3]
- Entry and exit
- Barriers to entry are high.[4] The most important barriers are government licenses, economies of scale, patents, access to expensive and complex technology, and strategic actions by incumbent firms designed to discourage or destroy nascent firms. Additional sources of barriers to entry often result from government regulation favoring existing firms making it difficult for new firms to enter the market.[5]
- Number of firms
- "Few" – a "handful" of sellers.[4] There are so few firms that the actions of one firm can influence the actions of the other firms.[6]
- Long run profits
- Oligopolies can retain long run abnormal profits. High barriers of entry prevent sideline firms from entering market to capture excess profits.
- Product differentiation
- Product may be homogeneous (steel) or differentiated (automobiles).[5]
- Perfect knowledge
- Assumptions about perfect knowledge vary but the knowledge of various economic factors can be generally described as selective. Oligopolies have perfect knowledge of their own cost and demand functions, but their inter-firm information may be incomplete. Buyers have only imperfect knowledge as to price,[4] cost and product quality.
- Interdependence
- The distinctive feature of an oligopoly is interdependence.[7] Oligopolies are typically composed of a few large firms. Each firm is so large that its actions affect market conditions. Therefore, the competing firms will be aware of a firm's market actions and will respond appropriately. This means that in contemplating a market action, a firm must take into consideration the possible reactions of all competing firms and the firms' countermoves.[8] It is very much like a game of chess, in which a player must anticipate a whole sequence of moves and countermoves in order to determine how to achieve his or her objectives; this is known as game theory. For example, an oligopoly considering a price reduction may wish to estimate the likelihood that competing firms would also lower their prices and possibly trigger a ruinous price war. Or if the firm is considering a price increase, it may want to know whether other firms will also increase prices or hold existing prices constant. This anticipation leads to price rigidity, as firms will only be willing to adjust their prices and quantity of output in accordance with a "price leader" in the market. This high degree of interdependence and need to be aware of what other firms are doing or might do stands in contrast with the lack of interdependence in other market structures. In a perfectly competitive (PC) market there is zero interdependence because no firm is large enough to affect market price. All firms in a PC market are price takers, as current market selling price can be followed predictably to maximize short-term profits. In a monopoly, there are no competitors to be concerned about. In a monopolistically-competitive market, each firm's effects on market conditions is so negligible as to be safely ignored by competitors.
- Non-Price Competition
- Oligopolies tend to compete on terms other than price. Loyalty schemes, advertisement, and product differentiation are all examples of non-price competition.
Oligopolies in countries with competition laws
Oligopolies become "mature" when competing entities realize they can maximize profits through joint efforts designed to maximize price control by minimizing the influence of competition. As a result of operating in countries with enforced antitrust laws, oligopolists will operate under tacit collusion, which is collusion through an understanding among the competitors of a market that by collectively raising prices, each participating competitor can achieve economic profits comparable to those achieved by a monopolist while avoiding the explicit breach of market regulations. Hence, the kinked demand curve for a joint profit-maximizing oligopoly industry can model the behaviors of oligopolists' pricing decisions other than that of the price leader (the price leader being the entity that all other entities follow in terms of pricing decisions). This is because if an entity unilaterally raises the prices of their good/service and competing entities do not follow, the entity that raised their price will lose a significant market as they face the elastic upper segment of the demand curve. As the joint profit-maximizing efforts achieve greater economic profits for all participating entities, there becomes an incentive for an individual entity to "cheat" by expanding output to gain greater market share and profit. In the case of oligopolist cheating, when the incumbent entity discovers this breach in collusion, competitors in the market will retaliate by matching or dropping prices lower than the original drop. Hence, the market share originally gained by having dropped the price will be minimised or eliminated. This is why on the kinked demand curve model the lower segment of the demand curve is inelastic. As a result, in such markets price rigidity prevails.
Modeling
There is no single model describing the operation of an oligopolistic market.[8] The variety and complexity of the models exist because you can have two to 10 firms competing on the basis of price, quantity, technological innovations, marketing, and reputation. However, there are a series of simplified models that attempt to describe market behavior by considering certain circumstances. Some of the better-known models are the dominant firm model, the Cournot–Nash model, the Bertrand model and the kinked demand model.
Cournot–Nash model
The Cournot–Nash model is the simplest oligopoly model. The model assumes that there are two "equally positioned firms"; the firms compete on the basis of quantity rather than price and each firm makes an "output of decision assuming that the other firm's behavior is fixed."[9] The market demand curve is assumed to be linear and marginal costs are constant. To find the Cournot–Nash equilibrium one determines how each firm reacts to a change in the output of the other firm. The path to equilibrium is a series of actions and reactions. The pattern continues until a point is reached where neither firm desires "to change what it is doing, given how it believes the other firm will react to any change."[10] The equilibrium is the intersection of the two firm's reaction functions. The reaction function shows how one firm reacts to the quantity choice of the other firm.[11] For example, assume that the firm 1's demand function is P = (M − Q2) − Q1 where Q2 is the quantity produced by the other firm and Q1 is the amount produced by firm 1,[12] and M=60 is the market. Assume that marginal cost is CM=12. Firm 1 wants to know its maximizing quantity and price. Firm 1 begins the process by following the profit maximization rule of equating marginal revenue to marginal costs. Firm 1's total revenue function is RT = Q1 P = Q1(M − Q2 − Q1) = MQ1 − Q1 Q2 − Q12. The marginal revenue function is .[note 1]

- RM = CM
- M − Q2 − 2Q1 = CM
- 2Q1 = (M − CM) − Q2
- Q1 = (M − CM)/2 − Q2/2 = 24 − 0.5 Q2 [1.1]
- Q2 = 2(M − CM) − 2Q1 = 96 − 2 Q1 [1.2]
Equation 1.1 is the reaction function for firm 1. Equation 1.2 is the reaction function for firm 2.
To determine the Cournot–Nash equilibrium you can solve the equations simultaneously. The equilibrium quantities can also be determined graphically. The equilibrium solution would be at the intersection of the two reaction functions. Note that if you graph the functions the axes represent quantities.[13] The reaction functions are not necessarily symmetric.[14] The firms may face differing cost functions in which case the reaction functions would not be identical nor would the equilibrium quantities.
Bertrand model
The Bertrand model is essentially the Cournot–Nash model except the strategic variable is price rather than quantity.[15]
The model assumptions are:
- There are two firms in the market
- They produce a homogeneous product
- They produce at a constant marginal cost
- Firms choose prices PA and PB simultaneously
- Firms outputs are perfect substitutes
- Sales are split evenly if PA = PB[16]
The only Nash equilibrium is PA = PB = MC.
Neither firm has any reason to change strategy. If the firm raises prices it will lose all its customers. If the firm lowers price P < MC then it will be losing money on every unit sold.[17]
The Bertrand equilibrium is the same as the competitive result.[18] Each firm will produce where P = marginal costs and there will be zero profits.[15] A generalization of the Bertrand model is the Bertrand–Edgeworth model that allows for capacity constraints and more general cost functions.
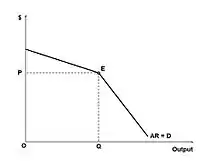
Oligopolistic market: Kinked demand curve model
According to this model, each firm faces a demand curve kinked at the existing price.[19] The conjectural assumptions of the model are; if the firm raises its price above the current existing price, competitors will not follow and the acting firm will lose market share and second if a firm lowers prices below the existing price then their competitors will follow to retain their market share and the firm's output will increase only marginally.[20]
If the assumptions hold then:
- The firm's marginal revenue curve is discontinuous (or rather, not differentiable), and has a gap at the kink[19]
- For prices above the prevailing price the curve is relatively elastic[21]
- For prices below the point the curve is relatively inelastic[21]
The gap in the marginal revenue curve means that marginal costs can fluctuate without changing equilibrium price and quantity.[19] Thus prices tend to be rigid.
Examples
Many industries have been cited as oligopolistic, including civil aviation,[22] agricultural pesticides,[22] electricity,[23][24] and platinum group metal mining.[25] In most countries, the telecommunications sector is characterized by an oligopolistic market structure.[24][26] Rail freight markets in the European Union have an oligopolistic structure.[27] In the United States, industries that have identified as oligopolistic include food processing,[28] funeral services,[29] sugar refining,[30] beer,[31] and pulp and paper.[32]
Market power and market concentration can be estimated or quantified using several different tools and measurements, including the Lerner index, stochastic frontier analysis, and New Empirical Industrial Organization (NEIO) modeling,[28] as well as the Herfindahl-Hirschman index.[25]
Demand curve
In an oligopoly, firms operate under imperfect competition. With the fierce price competitiveness created by this sticky-upward demand curve, firms use non-price competition in order to accrue greater revenue and market share.
"Kinked" demand curves are similar to traditional demand curves, as they are downward-sloping. They are distinguished by a hypothesized convex bend with a discontinuity at the bend–"kink". Thus the first derivative at that point is undefined and leads to a jump discontinuity in the marginal revenue curve.
Classical economic theory assumes that a profit-maximizing producer with some market power (either due to oligopoly or monopolistic competition) will set marginal costs equal to marginal revenue. This idea can be envisioned graphically by the intersection of an upward-sloping marginal cost curve and a downward-sloping marginal revenue curve (because the more one sells, the lower the price must be, so the less a producer earns per unit). In classical theory, any change in the marginal cost structure (how much it costs to make each additional unit) or the marginal revenue structure (how much people will pay for each additional unit) will be immediately reflected in a new price and/or quantity sold of the item. This result does not occur if a "kink" exists. Because of this jump discontinuity in the marginal revenue curve, marginal costs could change without necessarily changing the price or quantity.
The motivation behind this kink is the idea that in an oligopolistic or monopolistically competitive market, firms will not raise their prices because even a small price increase will lose many customers. This is because competitors will generally ignore price increases, with the hope of gaining a larger market share as a result of now having comparatively lower prices. However, even a large price decrease will gain only a few customers because such an action will begin a price war with other firms. The curve is, therefore, more price-elastic for price increases and less so for price decreases. Theory predicts that firms will enter the industry in the long run.
See also
Notes
- RM = M − Q2 − 2Q1. can be restated as RM = (M − Q2) − 2Q1.
References
- "Competition Counts". 11 June 2013. Retrieved 23 March 2018.
- Foundations of Real-World Economics. page 103. Routledge 2019.
- Perloff, J. Microeconomics Theory & Applications with Calculus. page 445. Pearson 2008.
- Hirschey, M. Managerial Economics. Rev. Ed, page 451. Dryden 2000.
- Negbennebor, A: Microeconomics, The Freedom to Choose CAT 2001
- Negbennebor, A: Microeconomics, The Freedom to Choose page 291. CAT 2001
- Melvin & Boyes, Microeconomics 5th ed. page 267. Houghton Mifflin 2002
- Colander, David C. Microeconomics 7th ed. Page 288 McGraw-Hill 2008.
- This statement is the Cournot conjectures. Kreps, D.: A Course in Microeconomic Theory page 326. Princeton 1990.
- Kreps, D. A Course in Microeconomic Theory. page 326. Princeton 1990.
- Kreps, D. A Course in Microeconomic Theory. Princeton 1990.
- Samuelson, W & Marks, S. Managerial Economics. 4th ed. Wiley 2003
- Pindyck, R & Rubinfeld, D: Microeconomics 5th ed. Prentice-Hall 2001
- Pindyck, R & Rubinfeld, D: Microeconomics 5th ed. Prentice-Hall 2001
- Samuelson, W. & Marks, S. Managerial Economics. 4th ed. page 415 Wiley 2003.
- There is nothing to guarantee an even split. Kreps, D.: A Course in Microeconomic Theory page 331. Princeton 1990.
- This assumes that there are no capacity restriction. Binger, B & Hoffman, E, 284–85. Microeconomics with Calculus, 2nd ed. Addison-Wesley, 1998.
- Pindyck, R & Rubinfeld, D: Microeconomics 5th ed.page 438 Prentice-Hall 2001.
- Pindyck, R. & Rubinfeld, D. Microeconomics 5th ed. page 446. Prentice-Hall 2001.
- Simply stated the rule is that competitors will ignore price increases and follow price decreases. Negbennebor, A: Microeconomics, The Freedom to Choose page 299. CAT 2001
- Negbennebor, A. Microeconomics: The Freedom to Choose. page 299. CAT 2001
- Adriana Gama, Review of Regulating the Polluters: Markets and Strategies for Protecting the Global Environment by Alexander Ovodenko, Global Environmental Politics, MIT Press, Vol. 19, No. 3, August 2019, pp. 143-145.
- Seyedamirabbas Mousavian, Antonio J. Conejo & Ramteen Sioshansi, Equilibria in investment and spot electricity markets: A conjectural-variations approach, European Journal of Operational Research, Vol. 281, Issue 1 (Feb. 2020), pp. 129-140.
- Woohyung Lee, Tohru Naito & Ki-Dong Lee, Effects of Mixed Oligopoly and Emission Taxes on the Market and Environment, Korean Economic Review, Vol. 33, No. 2, Winter 2017, pp. 267-294: "we have witnessed mixed oligopolistic markets in a broad range of industries, such as oil, electricity, telecommunications, and power plants that emit pollutants during their respective production processes."
- Magnus Ericsson & Andreas Tegen, Brief Report: Global PGM mining during 40 years—a stable corporate landscape of oligopolistic control, Mineral Economics, Vol. 29, pp. 29–36 (2016).
- Alex Borodin, Makpal Zholamanova, Galina Panaedova & Svetlana Frumina, Efficiency of price competition in the telecommunications market, E3S Web of Conferences Vol. 159, No. 03003 (2020): "It is considered that the telecommunications market has an oligopolistic structure in most countries."
- Anuradha Jain & Dirk Bruckmann, Application of the Principles of Energy Exchanges to the Rail Freight Sector, Transportation Research Record: Journal of the Transportation Research Board Vol. 2609, issue 1, pp. 28-35 (1 Jan. 2017): "most of the rail freight markets still have an oligopolistic structure..."
- Rigoberto A. Lopez, Xi He & Azzeddine Azzam, Stochastic Frontier Estimation of Market Power in the Food Industries, Journal of Agricultural Economics, Vol. 69, Issue 1 (Feb. 2018), pp. 3-17.
- Jennifer DiCamillo Lares & Kruti Lehenbauer, Funeral Services: The Silent Oligopoly: An Exploration of the Funeral Industry in the United States, RAIS Journal for Social Sciences, Vol. 3, No. 2 (2019).
- Alfred S. Eichner, The Emergence of Oligopoly: Sugar Refining as a Case Study (Johns Hopkins University Press, 2019).
- Nathan H. Miller, Gloria Sheu & Matthew C. Weinberg, Oligopolistic Price Leadership and Mergers: The United States Beer Industry (14 June 2019).
- Eddie Watkins, The Dynamic Effects of Recycling on Oligopoly Competition: Evidence from the US Paper Industry (29 Oct. 2018).
Further reading
| Wikimedia Commons has media related to Oligopoly. |
- Bayer, R. C. (2010). Intertemporal price discrimination and competition. Journal of economic behavior & organization, 73(2), 273–293.