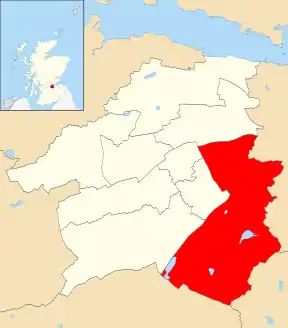
East Livingston and East Calder (ward)
East Livingston and East Calder is one of the nine wards used to elect members of the West Lothian Council. It elects four Councillors.
Location of the ward [1]
Councillors
| Election | Councillors | |||||||
|---|---|---|---|---|---|---|---|---|
| 2007 | Frank Anderson (SNP) |
Carl John (SNP) |
Willie Dunn (Labour) |
Dave King (Labour) | ||||
| 2012 | Frank Toner (Labour) | |||||||
| 2017 | Damian Timson (Conservative) | |||||||
Election Results
2017 Election
2017 West Lothian Council election [2]
| Party | Candidate | FPv% | Count | |||||||
|---|---|---|---|---|---|---|---|---|---|---|
| 1 | 2 | 3 | 4 | 5 | 6 | 7 | ||||
| Labour | Dave King (incumbent) | 23.75% | 1,749 | |||||||
| Conservative | Damian Timson | 22.00% | 1,620 | |||||||
| SNP | Frank Anderson (incumbent) | 20.09% | 1,479 | |||||||
| SNP | Carl John (incumbent) | 13.20% | 972 | 994 | 998 | 1,002 | 1,014 | 1,105 | 1,648 | |
| Labour | Scott Rogers | 7.13% | 525 | 724 | 765 | 766 | 829 | 918 | 941 | |
| SNP | Veronica Smith | 7.54% | 555 | 561 | 564 | 565 | 578 | 652 | ||
| Scottish Green | Neal Drummond | 3.60% | 265 | 274 | 284 | 285 | 366 | |||
| Liberal Democrats | Charles Corser | 2.69% | 198 | 208 | 239 | 239 | ||||
| Electorate: TBC Valid: 7,363 Spoilt: 141 Quota: 1,473 Turnout: 45.9% | ||||||||||
2012 Election
2012 West Lothian Council election [4]
| Party | Candidate | FPv% | Count | |||||
|---|---|---|---|---|---|---|---|---|
| 1 | 2 | 3 | 4 | 5 | ||||
| Labour | Dave King (incumbent) | 32.14 | 1,914 | |||||
| SNP | Frank Anderson (incumbent) | 19.26 | 1,147 | 1,161.7 | 1,164.8 | 1,180.9 | 1,398.6 | |
| SNP | Carl John (incumbent) | 16.89 | 1,006 | 1,058.4 | 1,061.2 | 1,094.1 | 1,304.3 | |
| Labour | Frank Toner | 11.45 | 682 | 1,237.6 | ||||
| SNP | Lis Bardell | 7.62 | 454 | 462.3 | 464.5 | 485.9 | ||
| Action to Save St John's Hospital | Jean Ann Finch | 6.38 | 380 | 407.9 | 419.3 | 607.3 | 637.3 | |
| Conservative | Evelyn Stirling | 6.25 | 372 | 386.7 | 389.9 | |||
| Electorate: 14,346 Valid: 5,955 Spoilt: 92 Quota: 1,192 Turnout: 6,047 (41.51%) | ||||||||
2007 Election
2007 West Lothian Council election
| Party | Candidate | 1st Pref | % | Seat | Count | |
|---|---|---|---|---|---|---|
| SNP | Frank Anderson | 1,918 | 24.6 | 1 | 1 | |
| Labour | Willie Dunn | 1,733 | 22.3 | 2 | 1 | |
| Labour | Dave King | 1,569 | 20.2 | 3 | 1 | |
| SNP | Carl John | 795 | 10.2 | 4 | 7 | |
| Action to Save St John's Hospital | Lorraine Robertson | 625 | 8.0 | |||
| Conservative | Andy Murray | 591 | 7.6 | |||
| Liberal Democrats | James Chapman | 421 | 5.4 | |||
| Scottish Socialist | Helen Donnelly | 133 | 1.7 | |||
References
- "5th Reviews - ward maps | Scottish Boundary Commission". Lgbc-scotland.gov.uk. Retrieved 2020-03-10.
- https://www.westlothian.gov.uk/article/13871/Council-Election-results-2017
- https://www.westlothian.gov.uk/article/13920/Ward-5-East-Livingston-and-East-Calder-2017-Results
- https://www.westlothian.gov.uk/article/48645/Previous-Election-Results
This article is issued from Wikipedia. The text is licensed under Creative Commons - Attribution - Sharealike. Additional terms may apply for the media files.
