Electoral district of Lee
Lee is a single-member electoral district for the South Australian House of Assembly. Named after the women's suffrage campaigner Mary Lee, it is an 18.9 km² suburban electorate on Adelaide's north-western beaches, taking in the suburbs of Grange, Royal Park, Seaton, Semaphore Park, Tennyson, West Lakes, and West Lakes Shore.
| Lee South Australia—House of Assembly | |||||||||||||||
|---|---|---|---|---|---|---|---|---|---|---|---|---|---|---|---|
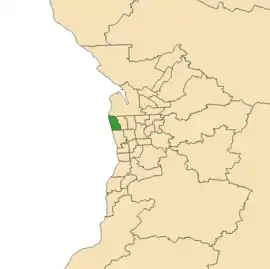 Electoral district of Lee (green) in the Greater Adelaide area | |||||||||||||||
| State | South Australia | ||||||||||||||
| Created | 1993 | ||||||||||||||
| MP | Stephen Mullighan | ||||||||||||||
| Party | Australian Labor Party (SA) | ||||||||||||||
| Namesake | Mary Lee | ||||||||||||||
| Electors | 26,500 (2018) | ||||||||||||||
| Area | 18.9 km2 (7.3 sq mi) | ||||||||||||||
| Demographic | Metropolitan | ||||||||||||||
| Coordinates | 34°51′31″S 138°29′56″E | ||||||||||||||
| |||||||||||||||
| Footnotes | |||||||||||||||
| Electoral District map[1] | |||||||||||||||
Lee was created as a fairly safe Labor electorate in the 1991 electoral distribution to replace the abolished electoral district of Albert Park and absorbed half of the abolished electoral district of Semaphore. The first member for Lee, elected at the 1993 election, was controversial Liberal MP Joe Rossi, with the governments smallest margin of 1.1 percent; Rossi's election was unexpected, but was part of a large swing away from Labor throughout the state. At the 1997 election there were large swings back to Labor. Rossi's small margin meant he was one of the first to be defeated. He was replaced by Labor's Michael Wright.
Port Adelaide Enfield Mayor Gary Johanson, who contested the 2012 Port Adelaide by-election as an independent, contested Lee at the 2014 election.[2] Wright did not contest the 2014 election. Labor candidate Stephen Mullighan won the election with a reduced 4.5 percent two-party preferred margin.
Members for Lee
| Member | Party | Term | |
|---|---|---|---|
| Joe Rossi | Liberal | 1993–1997 | |
| Michael Wright | Labor | 1997–2014 | |
| Stephen Mullighan | Labor | 2014–present | |
Election results
| Party | Candidate | Votes | % | ±% | |
|---|---|---|---|---|---|
| Labor | Stephen Mullighan | 9,845 | 42.5 | +0.4 | |
| Liberal | Steven Rypp | 8,203 | 35.4 | −5.5 | |
| SA-Best | Andy Legrand | 2,953 | 12.7 | +12.7 | |
| Greens | Patrick O'Sullivan | 1,023 | 4.4 | −1.6 | |
| Conservatives | Vicki Jessop | 731 | 3.2 | −0.7 | |
| Dignity | Tiffany Littler | 304 | 1.3 | +1.3 | |
| Danig | Aristidis Kerpelis | 127 | 0.5 | +0.5 | |
| Total formal votes | 23,186 | 95.6 | −1.0 | ||
| Informal votes | 1,065 | 4.4 | +1.0 | ||
| Turnout | 24,251 | 91.5 | +2.1 | ||
| Two-party-preferred result | |||||
| Labor | Stephen Mullighan | 12,485 | 53.8 | +2.3 | |
| Liberal | Steven Rypp | 10,701 | 46.2 | −2.3 | |
| Labor hold | Swing | +2.3 | |||
Notes
- Electoral District of Lee (Map). Electoral Commission of South Australia. 2018. Retrieved 1 April 2018.
- Contest in seat of Lee heats up with Adelaide Enfield Mayor Gary Johanson joining the election race, 13 December 2013, The Advertiser.
- State Election Results – District Results for Lee, ECSA.