Electoral history of Newt Gingrich
This is the electoral history of Newt Gingrich. Gingrich, a Republican, served as the 50th Speaker of the United States House of Representatives from 1995 until his resignation in November 1998. He represented Georgia's 6th congressional district as a Republican from 1979 until his resignation in January 1999. In 2012, Gingrich was a candidate for the Republican Party presidential nomination.
| ||
|---|---|---|
|
U.S. Speaker of the House
2012 presidential election
|
||
Georgia's 6th congressional district
1974 election
| Party | Candidate | Votes | % | |
|---|---|---|---|---|
| Democratic | Jack Flynt* | 49,082 | 51.45 | |
| Republican | Newt Gingrich | 46,308 | 48.55 | |
| Total votes | 95,390 | 100.00 | ||
1976 election
| Party | Candidate | Votes | % | |
|---|---|---|---|---|
| Democratic | Jack Flynt* | 77,532 | 51.71 | |
| Republican | Newt Gingrich | 72,400 | 48.29 | |
| Total votes | 149,932 | 100.00 | ||
1978 election
| Party | Candidate | Votes | % | |
|---|---|---|---|---|
| Republican | Newt Gingrich | 4,597 | 75.56 | |
| Republican | David Barrow | 952 | 15.65 | |
| Republican | Michael W. "Mike" Esther | 535 | 8.79 | |
| Total votes | 6,084 | 100.00 | ||
| Party | Candidate | Votes | % | |
|---|---|---|---|---|
| Republican | Newt Gingrich | 47,078 | 54.40 | |
| Democratic | Virginia Shapard | 39,451 | 45.59 | |
| Total votes | 86,529 | 100.00 | ||
1980 election
| Party | Candidate | Votes | % | |
|---|---|---|---|---|
| Republican | Newt Gingrich* | 96,071 | 59.05 | |
| Democratic | Dock H. Davis | 66,606 | 40.94 | |
| Total votes | 149,932 | 100.00 | ||
Speaker of the House of Representatives
1995 election
| Party | Candidate | Votes | % | |
|---|---|---|---|---|
| Republican | Newt Gingrich (GA 6) | 228 | 52.54 | |
| Democratic | Dick Gephardt (MO 3) | 202 | 46.55 | |
| — | Present | 4 | 0.91 | |
| Total votes | 434 | 100 | ||
| Votes necessary | 218 | >50 | ||
1997 election
| Party | Candidate | Votes | % | |
|---|---|---|---|---|
| Republican | Newt Gingrich (GA 6) | 216[lower-alpha 1] | 50.83 | |
| Democratic | Dick Gephardt (MO 3) | 205 | 48.24 | |
| Republican | Jim Leach (IA 1) | 2 | 0.47 | |
| Republican | Robert Michel[lower-alpha 2] | 1 | 0.23 | |
| Republican | Robert Walker[lower-alpha 2] | 1 | 0.23 | |
| Total votes | 425[lower-alpha 3] | 100 | ||
| Votes necessary | 213 | >50 | ||
Notes
- Received a majority of the votes cast, and thus won the election, but failed to obtain a majority of the full membership (218).
- Not a member of the House at the time, retired.
- Six Republicans answered "present" during the roll call vote. These were not included in the vote count, only "votes cast for a person by name" were.
References
- "Our Campaigns - GA District 6 Race - Nov 05, 1974". www.ourcampaigns.com. Retrieved 2018-02-15.
- "Our Campaigns - GA District 6 Race - Nov 02, 1976". www.ourcampaigns.com. Retrieved 2018-02-15.
- "Our Campaigns - GA District 6 - R Primary Race - Aug 08, 1978". www.ourcampaigns.com. Retrieved 2018-02-15.
- "Our Campaigns - GA District 6 Race - Nov 07, 1978". www.ourcampaigns.com. Retrieved 2018-02-15.
- "Our Campaigns - GA District 6 Race - Nov 04, 1980". www.ourcampaigns.com. Retrieved 2018-02-15.
- "141 Cong. Rec. H3–4 (1995)" (PDF). Washington, D.C.: United States Government Publishing Office. January 4, 1995. Retrieved February 9, 2019.
- Heitshusen, Valerie; Beth, Richard S. (January 4, 2019). "Speakers of the House: Elections, 1913–2019" (PDF). CRS Report for Congress. Washington, D.C.: Congressional Research Service, the Library of Congress. Retrieved January 28, 2019.
- "143 Cong. Rec. H2–4 (1997)" (PDF). Washington, D.C.: United States Government Publishing Office. January 7, 1997. Retrieved February 9, 2019.
| Political and legislative career | 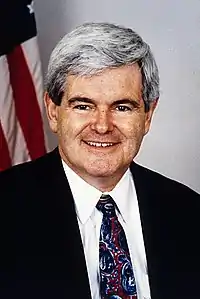 | ||||
|---|---|---|---|---|---|
| Selected books |
| ||||
| Related articles | |||||
This article is issued from Wikipedia. The text is licensed under Creative Commons - Attribution - Sharealike. Additional terms may apply for the media files.