Flow diagram
Flow diagram is a collective term for a diagram representing a flow or set of dynamic relationships in a system. The term flow diagram is also used as a synonym for flowchart,[1] and sometimes as a counterpart of the flowchart.[2]

Flow diagrams are used to structure and order a complex system, or to reveal the underlying structure of the elements and their interaction.[3]
Overview
The term flow diagram is used in theory and practice in different meanings. Most commonly the flow chart and flow diagram are used in an interchangeable way in the meaning of a representation of a process. For example the Information Graphics: A Comprehensive Illustrated Reference by Harris (1999) gives two separate definitions:
- Flow chart or flow diagram... is a diagram that visually displays interrelated information such as events, steps in a process, functions, etc., in an organized fashion, such as sequentially or chronologically.[4]
- Flow diagram [is] a graphic representation of the physical route or flow of people, materials, paperworks, vehicles, or communication associated with a process, procedure plan, or investigation.[2]
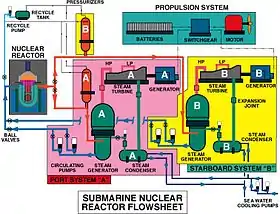
In the second definition the meaning is limited to the representation of the physical route or flow. An example of such a diagram is the illustration of the flows in a nuclear submarine propulsion system, which shows different streams back and forth in the system. The representation of such a system can be supplemented by one or more flowcharts, which show the sequence of one of the flows in one direction, or any of the control flows to manage the system.
The physical movement of objects from one location to another can also be visualized in a mix of maps and flowchart or sankey diagram, which are called flow maps. Flow maps can indicate on a map, what flows, moves or migrates, in which direction, and in which quantities etc.[5]
Specific types of flow diagrams

In theory and practice specific types of diagrams are also called a type of flow diagrams, such as:
- Alluvial diagram, highlights and summarizes the significant structural changes in networks
- Circular flow of income
- Control flow diagram, a diagram to describe the control flow of a business process, process or program
- Cumulative flow diagram, a tool used in queuing theory.
- Functional flow block diagram, in systems engineering
- Data flow diagram, a graphical representation of the flow of data through an information system
- Dynamic stock and flow diagram
- Information flow diagram, an illustration of information flow throughout an organisation.
- Process flow diagram, in Operations, a graphical representation of a process
- Product flow diagram (PFD), a graphical representation of the order by which a sequence of products is created according to Product based planning principles.
- A form of rap notation known as "flow diagram".
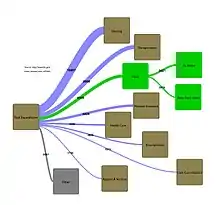
- Sankey diagram, where line width represents magnitude
- Signal-flow graph, in mathematics, a graphical means of showing the relations among the variables of a set of linear algebraic relations
- State diagram, a representation of a finite state machine
References
| Wikimedia Commons has media related to Flow diagram. |
- Robert L. Harris. Information Graphics: A Comprehensive Illustrated Reference. 2000. p. 153-155
- Harris. (1999, p. 156)
- Urs B. Meyer et al. Process Oriented Analysis: Design and Optimization of Industrial Production Systems. 2006. p. 38.
- Harris. (1999, p. 153)
- Harris. (1999, p. 157)
