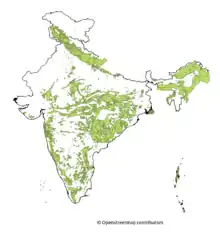
Forest cover by state in India
how many forests are there in india in 1947 in percentage
Tree density
Tree density is the quantification of how closely the trees are growing in a hectare area. It is not the exact number of trees in the forest but, serves as an estimate to the foresters.[1].The tree density of an area should be mentioned by the working Plan officer (WPO) or Divisional Forest Officer (Working Plan) after his field inspection of the lowest possible forest unit or compartment in the CH-3 form of compartment history. The compartment history forms are to be maintained at the Forest range and Forest division offices.[2] The working Plan code-2014 mentions in the para 105 that the density should also be mentioned on the stock map prepared by the WPO/DFO in decimal figures. The crown density is similar to the tree density. The forest area with density more than 0.4 are considered good forest area and forest area with less than 0.4 tree density are considered degraded forest.
Forest cover
Forest cover is the total geographical area declared as forest by the government. As of 2019, the total forest cover in India is 712,249 Sq km (71.22 million hectares), which is 21.67 percent of the total geographical area. Whereas, the total forest and tree cover in India is 807,276 Sq km (80.73 million hectors), which is 24.56 percent of the total geographical area of the country.
Forest cover over the years
| Year | Total forest area (in sq km) | % of forested area | %change |
|---|---|---|---|
| 2019[3] | 712,249 | 21.67% | |
| 2017[4] | 708,273 | 21.54% | |
| 2015[5] | 701,673 | 21.34% | |
| 2013[6] | 697,898 | 21.23% | |
| 2011[7] | 692,027 | 21.05% |
2017
The forest cover in 2017 in India by state and union territory as published by the Forest Survey of India (FSI) is shown in the table below.<re name="isfr2017">"India State of Forest Report, Forest Cover 2017" (PDF). Forest Survey of India. Retrieved 13 February 2018.</ref>
Very Dense= All lands with tree canopy density of 70 percent ( 0.7 tree density) and above.
Moderately Dense= All lands with tree canopy density of 40 percent and more but less than 70 percent ( 0.4 to 0.7 tree density).
Open Forest= All lands with tree canopy density of 10 percent and more but less than 40 percent (0.1 to 0.4 tree density).
Scrub= All forest lands with poor tree growth mainly of small or stunted trees canopy density less than 10 percent (Less than 0.1 tree density).
(Area in square kilometers)
| State / UT | Geographical Area | Very dense | Moderately dense | Open forest | Total forest area | % of forested area | % change since 2015 |
|---|---|---|---|---|---|---|---|
| Andhra Pradesh | 162,968 | 1,957 | 14,051 | 12,139 | 28,147 | 17.27% | +1.31% |
| Arunachal Pradesh | 83,743 | 20,721 | 30,955 | 15,288 | 66,964 | 79.96% | -0.23% |
| Assam | 78,438 | 2,797 | 10,192 | 15,116 | 28,105 | 35.83% | +0.72% |
| Bihar | 94,163 | 332 | 3,260 | 3,707 | 7,299 | 7.75% | +0.05% |
| Chhattisgarh | 135,192 | 7,064 | 32,215 | 16,268 | 55,547 | 41.09% | -0.01% |
| Delhi | 1,483 | 7 | 56 | 129 | 192 | 12.97% | +0.25% |
| Goa | 3,702 | 538 | 576 | 1,115 | 2,229 | 60.21% | +0.51% |
| Gujarat | 196,244 | 378 | 5,200 | 9,179 | 14,757 | 7.52% | +0.02% |
| Haryana | 44,212 | 28 | 452 | 1,108 | 1,588 | 3.59% | +0.02% |
| Himachal Pradesh | 55,673 | 3,110 | 6,705 | 5,285 | 15,100 | 27.12% | +0.71% |
| Jammu & Kashmir | 222,236 | 4,075 | 8,579 | 10,587 | 23,241 | 10.46% | +0.11% |
| Jharkhand | 79,716 | 2,598 | 9,686 | 11,269 | 23,553 | 29.55% | +0.04% |
| Karnataka | 191,791 | 4,502 | 20,444 | 12,604 | 37,550 | 19.58% | +0.57% |
| Kerala | 38,852 | 1,663 | 9,407 | 8,251 | 20,321 | 52.30% | +2.68% |
| Madhya Pradesh | 308,252 | 6,563 | 34,571 | 36,280 | 77,414 | 25.11% | -0.00% |
| Maharashtra | 307,713 | 8,736 | 20,652 | 21,294 | 50,682 | 16.47% | -0.01% |
| Manipur | 22,327 | 908 | 6,510 | 9,928 | 17,346 | 77.69% | +1.18% |
| Meghalaya | 22,429 | 453 | 9,386 | 7,307 | 17,146 | 76.76% | -0.52% |
| Mizoram | 21,081 | 131 | 5,861 | 12,194 | 18,186 | 86.27% | -2.52% |
| Nagaland | 16,579 | 1,279 | 4,587 | 6,623 | 12,489 | 75.33% | -2.71% |
| Odisha | 155,707 | 6,967 | 21,370 | 23,008 | 51,345 | 32.98% | +0.57% |
| Punjab | 50,362 | 8 | 806 | 1,023 | 1,837 | 3.65% | +0.13% |
| Rajasthan | 342,239 | 78 | 4,340 | 12,154 | 16,572 | 4.84% | +0.14% |
| Sikkim | 7,096 | 1,081 | 1,575 | 688 | 3,344 | 47.13% | -0.13% |
| Tamil Nadu | 130,060 | 3,672 | 10,979 | 11,630 | 26,281 | 20.21% | +0.06% |
| Telangana | 112,077 | 1,596 | 8,738 | 10,085 | 20,419 | 18.22% | +0.50% |
| Tripura | 10,486 | 656 | 5,246 | 1,824 | 7,726 | 73.68% | -1.56% |
| Uttar Pradesh | 240,928 | 2,617 | 4,069 | 7,993 | 14,679 | 6.09% | +0.12% |
| Uttarakhand | 53,483 | 4,969 | 12,884 | 6,442 | 24,295 | 45.43% | +0.04% |
| West Bengal | 88,752 | 2,994 | 4,147 | 9,706 | 16,847 | 18.98% | +0.02% |
| Andaman & Nicobar Islands | 8,249 | 5,678 | 684 | 380 | 6,742 | 81.73% | -0.11% |
| Chandigarh | 114 | 1 | 14 | 6 | 22 | 18.91% | -0.09% |
| Dadra & Nagar Haveli | 491 | 0 | 80 | 127 | 207 | 42.16% | +0.20% |
| Daman & Diu | 111 | 1 | 6 | 13 | 20 | 18.46% | +0.79% |
| Lakshadweep | 30 | 0 | 17 | 10 | 27 | 90.33% | 0.13% |
| Puducherry | 490 | 0 | 18 | 36 | 54 | 10.95% | -0.67% |
| Total | 3,287,469 | 98,158 | 308,318 | 301,797 | 708,273 | 21.54% | +0.21% |
2015
According to Forest Survey of India (FSI), the forest cover by State/UT in India in 2015 is listed below.[8]
Very Dense= All lands with tree canopy density of 70 percent and above.
Moderately Dense= All lands with tree canopy density of 40 percent and more but less than 70 percent.
Open Forest= All lands with tree canopy density of 10 percent and more but less than 40 percent.
(Area in square kilometers)
| State / UT | Geographical Area | Very dense | Moderately dense | Open forest |
|---|---|---|---|---|
| Andhra Pradesh | 162,968 | 421 | 14,352 | 11,233 |
| Arunachal Pradesh | 83,743 | 20,806 | 31,181 | 15,167 |
| Assam | 78,438 | 1,425 | 11,256 | 14,857 |
| Bihar | 94,163 | 248 | 3,362 | 3,644 |
| Chhattisgarh | 135,192 | 7,001 | 32,305 | 16,253 |
| Delhi | 1,483 | 6.94 | 57.15 | 154.68 |
| Goa | 3,702 | 536 | 580 | 1,094 |
| Gujarat | 196,244 | 378 | 5,198 | 9,134 |
| Haryana | 44,212 | 28 | 444 | 1,108 |
| Himachal Pradesh | 55,673 | 3,225 | 6,387 | 5,095 |
| Jammu & Kashmir | 222,236 | 4,061 | 8,815 | 10,112 |
| Jharkhand | 79,716 | 2,601 | 9,692 | 11,231 |
| Karnataka | 191,791 | 1,783 | 20,177 | 14,489 |
| Kerala | 38,852 | 1,529 | 9,328 | 8,421 |
| Madhya Pradesh | 308,252 | 6,586 | 34,837 | 36,003 |
| Maharashtra | 307,713 | 8,685 | 20,792 | 21,222 |
| Manipur | 22,327 | 729 | 5,964 | 10,390 |
| Meghalaya | 22,429 | 417 | 9,555 | 7,290 |
| Mizoram | 21,081 | 135 | 5,800 | 12,782 |
| Nagaland | 16,579 | 1,284 | 4,690 | 6,965 |
| Odisha | 155,707 | 6,985 | 21,470 | 22,005 |
| Punjab | 50,362 | 0 | 733 | 1,038 |
| Rajasthan | 342,239 | 77 | 4,414 | 11,615 |
| Sikkim | 7,096 | 499 | 2,157 | 697 |
| Tamil Nadu | 130,060 | 3,005 | 10,472 | 12,731 |
| Telangana | 112,077 | 465 | 11,340 | 8,049 |
| Tripura | 10,486 | 110 | 4,699 | 3,111 |
| Uttar Pradesh | 240,928 | 2,171 | 4,043 | 8,187 |
| Uttarakhand | 53,483 | 4,804 | 13,662 | 5,806 |
| West Bengal | 88,752 | 2,943 | 4,176 | 9,707 |
| Andaman & Nicobar Islands | 8,249 | 5,686 | 685 | 380 |
| Chandigarh | 114 | 1.36 | 13.92 | 6.38 |
| Dadra & Nagar Haveli | 491 | 0 | 80 | 126 |
| Daman & Diu | 111 | 1.4 | 5.82 | 12.39 |
| Lakshadweep | 30 | 0 | 17.22 | 9.84 |
| Puducherry | 490 | 0 | 28.78 | 28.17 |
| Total | 3,287,469 | 88,633 | 312,739 | 300,123 |
References
- https://www.hunker.com/13428942/how-to-calculate-tree-density
- file:///G:/Tpf/Working%20plan%20preparation.pdf
- "FSI 2019 Summary" (PDF).
- "FSI 2017 Forest Cover" (PDF).
- "FSI 2015 Summary" (PDF).
- "FSI 2013 Summary" (PDF).
- "FSI 2011 Summary" (PDF).
- "India State of Forest Report, Forest Cover 2017" (PDF). Forest Survey of India. Retrieved 13 February 2018.