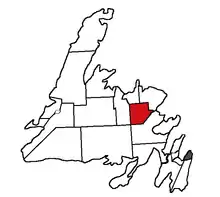
Gander (electoral district)
Gander is a provincial electoral district for the House of Assembly of Newfoundland and Labrador, Canada.
 | |||
| Coordinates: | 48.887°N 54.873°W | ||
| Provincial electoral district | |||
| Legislature | Newfoundland and Labrador House of Assembly | ||
| MHA |
Liberal | ||
| District created | 1967 | ||
| Last contested | 2019 | ||
| Demographics | |||
| Population (2011) | 14,725 | ||
| Electors (2015) | 9,874 | ||
| Area (km²) | 3,250 | ||
| Pop. density (per km²) | 4.5 | ||
| Census division(s) | Division No. 6, Division No. 7 | ||
| Census subdivision(s) | Appleton, Benton, Gambo, Gander, Glenwood | ||
It includes the town of Gander and the surrounding communities of Appleton, Gambo, Glenwood, and Benton. Gander, which has an airport and military history, is a service centre for a large region of the province. Voters in Gander often swing between the Liberal and Progressive Conservative columns, often electing members who sat on the government benches, making it an important swing district in the province.
Members of the House of Assembly
The district has elected the following Members of the House of Assembly:
| Assembly | Years | Member | Party | |
|---|---|---|---|---|
| 34th | 1966-1967 | Charles Ronald McKay Granger | Liberal | |
| 1967-1971 | Harold Anthony Collins | Progressive Conservative | ||
| 35th | 1972 | |||
| 36th | 1972-1975 | |||
| 37th | 1975-1979 | |||
| 38th | 1979-1982 | Hazel Rose Newhook | Progressive Conservative | |
| 39th | 1982-1985 | |||
| 40th | 1985-1989 | Winston Baker | Liberal | |
| 41st | 1989-1993 | |||
| 42nd | 1993-1995 | |||
| 1995-1996 | Gary Vey | Liberal | ||
| 43rd | 1996-1999 | Sandra Kelly | Liberal | |
| 44th | 1999-2003 | |||
| 45th | 2003-2007 | Kevin George O'Brien | Progressive Conservative | |
| 46th | 2007-2011 | |||
| 47th | 2011-2015 | |||
| 48th | 2015-2019 | John Haggie | Liberal | |
| 49th | 2019-present | |||
Election results
| 2019 Newfoundland and Labrador general election | ||||||||
|---|---|---|---|---|---|---|---|---|
| Party | Candidate | Votes | % | ±% | ||||
| Liberal | John Haggie | 3,311 | 58.6 | -9.0 | ||||
| Progressive Conservative | Ryan Wagg | 2,342 | 41.4 | +34.4 | ||||
| Total valid votes | 5,653 | 100 | ||||||
| Total rejected ballots | 73 | |||||||
| Turnout | 5,726 | 61.6 | +14.1 | |||||
| Eligible voters | 9,296 | |||||||
| 2015 Newfoundland and Labrador general election | ||||||||
|---|---|---|---|---|---|---|---|---|
| Party | Candidate | Votes | % | ±% | ||||
| Liberal | John Haggie | 3,151 | 67.56 | +36.65 | ||||
| New Democratic | Lukas Norman | 1,184 | 25.39 | +8.57 | ||||
| Progressive Conservative | Ryan Menchion | 329 | 7.05 | -45.22 | ||||
| Total valid votes | 4,664 | 99.53 | – | |||||
| Total rejected ballots | 22 | 0.47 | – | |||||
| Turnout | 4,686 | 47.46 | -5.61 | |||||
| Eligible voters | 9,874 | |||||||
| Liberal gain from Progressive Conservative | Swing | +22.61 | ||||||
| Source: Elections Newfoundland and Labrador[1] | ||||||||
| 2011 Newfoundland and Labrador general election | ||||||||
|---|---|---|---|---|---|---|---|---|
| Party | Candidate | Votes | % | ±% | ||||
| Progressive Conservative | Kevin O'Brien | 2,393 | 52.27 | -22.83 | ||||
| Liberal | Barry Warren | 1,415 | 30.91 | +6.01 | ||||
| New Democratic | Lukas Norman | 770 | 16.82 | +16.82 | ||||
| Total valid votes | 4,578 | 99.65 | – | |||||
| Total rejected ballots | 16 | 0.35 | – | |||||
| Turnout | 4,594 | 53.07 | -2.85 | |||||
| Eligible voters | 8,656 | |||||||
| Progressive Conservative hold | Swing | -14.42 | ||||||
| Source: Elections Newfoundland and Labrador[2] | ||||||||
| 2007 Newfoundland and Labrador general election | ||||||||
|---|---|---|---|---|---|---|---|---|
| Party | Candidate | Votes | % | ±% | ||||
| Progressive Conservative | Kevin O'Brien | 3,599 | 75.10 | +13.72 | ||||
| Liberal | Stephanie Winsor | 1,193 | 24.90 | -7.82 | ||||
| Total valid votes | 4,792 | 99.01 | – | |||||
| Total rejected ballots | 48 | 0.99 | – | |||||
| Turnout | 4,840 | 55.92 | -2.59 | |||||
| Eligible voters | 8,656 | |||||||
| Progressive Conservative hold | Swing | +10.77 | ||||||
| Source: Elections Newfoundland and Labrador[3] | ||||||||
| 2003 Newfoundland and Labrador general election | ||||||||
|---|---|---|---|---|---|---|---|---|
| Party | Candidate | Votes | % | ±% | ||||
| Progressive Conservative | Kevin O'Brien | 3,621 | 61.38 | +14.06 | ||||
| Liberal | Diane Crewe | 1,930 | 32.72 | -16.84 | ||||
| New Democratic | Steve Johnson | 348 | 5.90 | +2.78 | ||||
| Total valid votes | 5,899 | 99.88 | – | |||||
| Total rejected ballots | 7 | 0.12 | – | |||||
| Turnout | 5,906 | 58.51 | -1.18 | |||||
| Eligible voters | 10,094 | |||||||
| Progressive Conservative gain from Liberal | Swing | +15.45 | ||||||
| Source: Elections Newfoundland and Labrador[4] | ||||||||
| 1999 Newfoundland and Labrador general election | ||||||||
|---|---|---|---|---|---|---|---|---|
| Party | Candidate | Votes | % | ±% | ||||
| Liberal | Sandra Kelly | 3,064 | 49.56 | -6.24 | ||||
| Progressive Conservative | Kevin O'Brien | 2,926 | 47.32 | +3.12 | ||||
| New Democratic | Roy Locke | 193 | 3.12 | +3.12 | ||||
| Total valid votes | 6,183 | 99.84 | – | |||||
| Total rejected ballots | 10 | 0.16 | – | |||||
| Turnout | 6,193 | 59.69 | -10.02 | |||||
| Eligible voters | 10,375 | |||||||
| Liberal hold | Swing | -4.68 | ||||||
| Source: Elections Newfoundland and Labrador[5] | ||||||||
| 1996 Newfoundland and Labrador general election | ||||||||
|---|---|---|---|---|---|---|---|---|
| Party | Candidate | Votes | % | ±% | ||||
| Liberal | Sandra Kelly | 3,585 | 55.80 | +7.99 | ||||
| Progressive Conservative | Dan Crummell | 2,840 | 44.20 | -2.70 | ||||
| Total valid votes | 6,425 | 99.60 | – | |||||
| Total rejected ballots | 26 | 0.40 | – | |||||
| Turnout | 6,451 | 69.71 | +12.40 | |||||
| Eligible voters | 9,254 | |||||||
| Liberal hold | Swing | +5.35 | ||||||
| Source: Elections Newfoundland and Labrador[6] | ||||||||
| Newfoundland and Labrador provincial by-election, October 10, 1995 upon the resignation of Winston Baker | ||||||||
|---|---|---|---|---|---|---|---|---|
| Party | Candidate | Votes | % | ±% | ||||
| Liberal | Gary Vey | 2,421 | 47.81 | -15.59 | ||||
| Progressive Conservative | Dan Crummell | 2,375 | 46.90 | +19.85 | ||||
| New Democratic | Roy Locke | 268 | 5.29 | -4.26 | ||||
| Total valid votes | 5,064 | 99.90 | – | |||||
| Total rejected ballots | 5 | 0.10 | – | |||||
| Turnout | 5,069 | 57.31 | -3.52 | |||||
| Eligible voters | 8,845 | |||||||
| Liberal hold | Swing | -17.72 | ||||||
| Source: Elections Newfoundland and Labrador[7] | ||||||||
| 1993 Newfoundland and Labrador general election | ||||||||
|---|---|---|---|---|---|---|---|---|
| Party | Candidate | Votes | % | ±% | ||||
| Liberal | Winston Baker | 3,876 | 63.40 | +2.74 | ||||
| Progressive Conservative | John Elliott | 1,654 | 27.05 | -8.52 | ||||
| New Democratic | Roy Locke | 584 | 9.55 | +5.78 | ||||
| Total valid votes | 6,114 | 99.69 | – | |||||
| Total rejected ballots | 19 | 0.31 | – | |||||
| Turnout | 6,133 | 60.83 | -15.37 | |||||
| Eligible voters | 10,082 | |||||||
| Liberal hold | Swing | +5.63 | ||||||
| Source: Elections Newfoundland and Labrador[8] | ||||||||
| 1989 Newfoundland and Labrador general election | ||||||||
|---|---|---|---|---|---|---|---|---|
| Party | Candidate | Votes | % | ±% | ||||
| Liberal | Winston Baker | 3,460 | 60.66 | +4.28 | ||||
| Progressive Conservative | Agnes Richard | 2,029 | 35.57 | -3.94 | ||||
| New Democratic | Claude Elliott | 215 | 3.77 | -0.34 | ||||
| Total valid votes | 5,704 | 99.74 | – | |||||
| Total rejected ballots | 15 | 0.26 | – | |||||
| Turnout | 5,719 | 76.20 | -1.05 | |||||
| Eligible voters | 7,505 | |||||||
| Liberal hold | Swing | +4.11 | ||||||
| Source: Elections Newfoundland and Labrador[9] | ||||||||
| 1985 Newfoundland and Labrador general election | ||||||||
|---|---|---|---|---|---|---|---|---|
| Party | Candidate | Votes | % | ±% | ||||
| Liberal | Winston Baker | 3,309 | 56.38 | +19.33 | ||||
| Progressive Conservative | Hazel Newhook | 2,319 | 39.51 | -18.24 | ||||
| New Democratic | G. Joe Tremblett | 241 | 4.11 | -1.09 | ||||
| Total valid votes | 5,869 | 99.81 | – | |||||
| Total rejected ballots | 11 | 0.19 | – | |||||
| Turnout | 5,880 | 77.25 | +2.49 | |||||
| Eligible voters | 7,612 | |||||||
| Liberal gain from Progressive Conservative | Swing | +18.79 | ||||||
| Source: Elections Newfoundland and Labrador[10] | ||||||||
| 1982 Newfoundland and Labrador general election | ||||||||
|---|---|---|---|---|---|---|---|---|
| Party | Candidate | Votes | % | ±% | ||||
| Progressive Conservative | Hazel Newhook | 2,876 | 57.75 | +10.30 | ||||
| Liberal | Winston Baker | 1,845 | 37.05 | +15.88 | ||||
| New Democratic | Lowell Paulson | 259 | 5.20 | -26.18 | ||||
| Total valid votes | 4,980 | 99.82 | – | |||||
| Total rejected ballots | 9 | 0.18 | – | |||||
| Turnout | 4,989 | 74.76 | +0.04 | |||||
| Eligible voters | 6,673 | |||||||
| Progressive Conservative hold | Swing | +13.09 | ||||||
| Source: Elections Newfoundland and Labrador[11] | ||||||||
| 1979 Newfoundland and Labrador general election | ||||||||
|---|---|---|---|---|---|---|---|---|
| Party | Candidate | Votes | % | ±% | ||||
| Progressive Conservative | Hazel Newhook | 2,362 | 47.45 | -9.62 | ||||
| New Democratic | Winston Baker | 1,564 | 31.38 | +31.38 | ||||
| Liberal | Randy Simms | 1,054 | 21.17 | -21.76 | ||||
| Total valid votes | 4,978 | 99.84 | – | |||||
| Total rejected ballots | 8 | 0.16 | – | |||||
| Turnout | 4,986 | 74.72 | -2.20 | |||||
| Eligible voters | 6,673 | |||||||
| Progressive Conservative hold | Swing | -20.50 | ||||||
| Source: Elections Newfoundland and Labrador[12] | ||||||||
| 1975 Newfoundland general election | ||||||||
|---|---|---|---|---|---|---|---|---|
| Party | Candidate | Votes | % | ±% | ||||
| Progressive Conservative | Harold Collins | 2,462 | 57.07 | -8.55 | ||||
| Liberal | Averill Baker | 1,852 | 42.93 | +11.03 | ||||
| Total valid votes | 4,314 | 99.91 | – | |||||
| Total rejected ballots | 4 | 0.09 | – | |||||
| Turnout | 4,318 | 76.92 | -0.67 | |||||
| Eligible voters | 5,614 | |||||||
| Progressive Conservative hold | Swing | -9.79 | ||||||
| Source: Elections Newfoundland and Labrador[13] | ||||||||
| 1972 Newfoundland general election | ||||||||
|---|---|---|---|---|---|---|---|---|
| Party | Candidate | Votes | % | ±% | ||||
| Progressive Conservative | Harold Collins | 4,674 | 65.62 | – | ||||
| Liberal | Eli Baker | 2,272 | 31.90 | – | ||||
| New Democratic | Earl Reginald Boone | 177 | 2.48 | – | ||||
| Total valid votes | 7,123 | 99.35 | – | |||||
| Total rejected ballots | 26 | 0.65 | – | |||||
| Turnout | 7,149 | 77.59 | ||||||
| Eligible voters | 9,214 | |||||||
| Progressive Conservative hold | Swing | – | ||||||
| Source: Elections Newfoundland and Labrador[14] | ||||||||
References
- "2015 Provincial General Election Report" (PDF). Elections Newfoundland and Labrador. 25 July 2016. Archived from the original (PDF) on 18 July 2017. Retrieved 21 November 2018.
- "Report on the Provincial General Election, October 11, 2011" (PDF). Office of the Chief Electoral Officer of Newfoundland and Labrador. 8 June 2012. Archived from the original (PDF) on 4 March 2016. Retrieved 21 November 2018.
- "Report on the Provincial General Election, October 9, 2007" (PDF). Office of the Chief Electoral Officer of Newfoundland and Labrador. 7 July 2008. Archived from the original (PDF) on 20 October 2016. Retrieved 21 November 2018.
- "Report on the October 21, 2003 General Election" (PDF). Office of the Chief Electoral Officer of Newfoundland and Labrador. 9 July 2004. Archived from the original (PDF) on 4 March 2016. Retrieved 21 November 2018.
- "Report of the Chief Electoral Officer on the General Election for the Forty-Fourth General Assembly, February 9, 1999" (PDF). Office of the Chief Electoral Officer of Newfoundland and Labrador. 9 November 1999. Archived from the original (PDF) on 28 November 2015. Retrieved 21 November 2018.
- "Report of the Chief Electoral Officer on the General Election for the Forty-Third General Assembly, February 22, 1996" (PDF). Office of the Chief Electoral Officer of Newfoundland and Labrador. 28 October 1996. Archived from the original (PDF) on 28 November 2015. Retrieved 21 November 2018.
- "Report of the Chief Electoral Officer on the Gander By-Election, October 10, 1995" (PDF). Office of the Chief Electoral Officer of Newfoundland and Labrador. 10 June 1996. Retrieved 26 December 2018.
- "Report of the Chief Electoral Officer on the General Election for the Forty-Second General Assembly, May 3, 1993" (PDF). Office of the Chief Electoral Officer of Newfoundland and Labrador. 1994. Archived from the original (PDF) on 28 November 2015. Retrieved 21 November 2018.
- "Election Statistics 1989" (PDF). Office of the Chief Electoral Officer of Newfoundland and Labrador. 1989. Archived from the original (PDF) on 4 March 2016. Retrieved 21 November 2018.
- "Election Returns 1985" (PDF). Office of the Chief Electoral Officer of Newfoundland and Labrador. 22 October 1985. Archived from the original (PDF) on 4 March 2016. Retrieved 21 November 2018.
- "Election Returns 1982" (PDF). Office of the Chief Electoral Officer of Newfoundland and Labrador. 25 August 1982. Archived from the original (PDF) on 23 November 2015. Retrieved 21 November 2018.
- "Election Returns 1979" (PDF). Office of the Chief Electoral Officer of Newfoundland and Labrador. 12 October 1979. Archived from the original (PDF) on 4 March 2016. Retrieved 22 November 2018.
- "Election Returns 1975" (PDF). Office of the Chief Electoral Officer of Newfoundland and Labrador. 30 April 1976. Archived from the original (PDF) on 23 November 2015. Retrieved 22 November 2018.
- "General Election Returns, March 24, 1972" (PDF). Office of the Chief Electoral Officer of Newfoundland and Labrador. 1973. Archived from the original (PDF) on 5 March 2016. Retrieved 22 November 2018.
External links
This article is issued from Wikipedia. The text is licensed under Creative Commons - Attribution - Sharealike. Additional terms may apply for the media files.