Glavinitsa Municipality
Glavinitsa Municipality (Bulgarian: Община Главиница) is a municipality (obshtina) in Silistra Province, Northeastern Bulgaria, located along the right bank of Danube river in the Danubian Plain in the area of the South Dobrudzha geographical region. It is named after its administrative centre – the town of Glavinitsa.
Glavinitsa Municipality
Община Главиница | |
|---|---|
Municipality | |
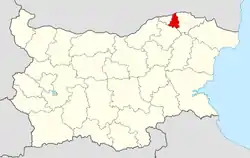 Glavinitsa Municipality within Bulgaria and Silistra Province. | |
| Coordinates: 43°56′N 26°50′E | |
| Country | Bulgaria |
| Province (Oblast) | Silistra |
| Admin. centre (Obshtinski tsentar) | Glavinitsa |
| Area | |
| • Total | 481.23 km2 (185.80 sq mi) |
| Population (December 2009)[2] | |
| • Total | 12,610 |
| • Density | 26/km2 (68/sq mi) |
| Time zone | UTC+2 (EET) |
| • Summer (DST) | UTC+3 (EEST) |
| Climate | Cfb |
The municipality embraces a territory of 481.23[1] km² with a population of 12,610 inhabitants, as of December 2009.[2]
The main road II-21 crosses the area from east to west, connecting the province centre of Silistra with the city of Ruse.
Settlements
.png.webp)
Glavinitsa Municipality includes the following 23 places all of them villages:
| Town/Village | Cyrillic | Population[3][4][5] (December 2009) |
|---|---|---|
| Glavinitsa | Главиница | 1,928 |
| Bashtino | Бащино | 167 |
| Bogdantsi | Богданци | 699 |
| Chernogor | Черногор | 451 |
| Dichevo | Дичево | 471 |
| Dolno Ryahovo | Долно Ряхово | 405 |
| Kalugerene | Калугерене | 551 |
| Kolarovo | Коларово | 369 |
| Kosara | Косара | 213 |
| Listets | Листец | 583 |
| Malak Preslavets | Малък Преславец | 365 |
| Nozharevo | Ножарево | 572 |
| Osen | Осен | 144 |
| Padina | Падина | 415 |
| Podles | Подлес | 187 |
| Sokol | Сокол | 353 |
| Kosara | Стефан Караджа | 1,031 |
| Suhodol | Суходол | 775 |
| Valkan | Вълкан | 383 |
| Zaritsa | Зарица | 446 |
| Zafirovo | Зафирово | 933 |
| Zvenimir | Звенимир | 454 |
| Zebil | Зебил | 715 |
| Total | 12,610 |
Demography
The following table shows the change of the population during the last four decades. Since 1992 Glavinitsa Municipality has comprised the former municipality of General Zafirovo and the numbers in the table reflect this unification.
| Glavinitsa Municipality | ||||||||
|---|---|---|---|---|---|---|---|---|
| Year | 1975 | 1985 | 1992 | 2001 | 2005 | 2007 | 2009 | 2011 |
| Population | 10,230 | 9,930 | 15,579 | 13,848 | 13,298 | 12,959 | 12,610 | ... |
| Sources: Census 2001,[6] Census 2011,[7] „pop-stat.mashke.org“,[8] | ||||||||
Ethnic groups
Ethnic Turks constitute the majority of the population of Glavinitsa Municipality, followed by a large Bulgarian minority and a small Roma community.
Demographic indicators
The municipality of Glavinitsa is losing many inhabitants. Last decade, the number of births decreased slightly while the number of deaths increased significantly.
| Population | Live births | Deaths | Natural growth | Birth rate (‰) | Death rate (‰) | Natural growth rate (‰) | |
|---|---|---|---|---|---|---|---|
| 2000 | 14,662 | 126 | 203 | −77 | 8.6 | 13.8 | −5.3 |
| 2001 | 13,743 | 126 | 201 | −75 | 9.2 | 14.6 | −5.5 |
| 2002 | 13,693 | 114 | 244 | −130 | 8.3 | 17.8 | −9.5 |
| 2003 | 13,564 | 118 | 201 | −83 | 8.7 | 14.8 | −6.1 |
| 2004 | 13,400 | 91 | 184 | −93 | 6.8 | 13.7 | −6.9 |
| 2005 | 13,298 | 110 | 193 | −83 | 8.3 | 14.5 | −6.2 |
| 2006 | 13,077 | 93 | 201 | −108 | 7.1 | 15.4 | 8.3 |
| 2007 | 12,959 | 122 | 203 | −81 | 9.4 | 15.7 | −6.3 |
| 2008 | 12,767 | 116 | 209 | −93 | 9.1 | 16.4 | −7.3 |
| 2009 | 12,610 | 122 | 162 | −40 | 9.7 | 12.8 | −3.2 |
| 2010 | 12,445 | 98 | 184 | −86 | 7.9 | 14.8 | −6.9 |
| 2011 | 10,797 | 95 | 198 | −103 | 8.8 | 18.3 | −9.5 |
| 2012 | 10,642 | 96 | 208 | −112 | 9.0 | 19.5 | −10.5 |
| 2013 | 10,553 | 103 | 171 | −68 | 9.8 | 16.2 | −6.4 |
| 2014 | 10,407 | 93 | 202 | −109 | 8.9 | 19.4 | −10.5 |
| 2015 | 10,360 | 98 | 197 | 99 | 9.5 | 19.0 | −9.6 |
| 2016 | 10,243 | 91 | 166 | −75 | 8.9 | 16.2 | −7.3 |
| 2017 | 10,085 | 82 | 169 | −87 | 8.1 | 16.8 | −8.6 |
| 2018 | 9,897 | 73 | 206 | -133 | 7.4 | 20.8 | -13.4 |
Religion
According to the latest Bulgarian census of 2011, the religious composition, among those who answered the optional question on religious identification, was the following:
References
- (in Bulgarian)Characterization of Silistra Province
- (in English) Bulgarian National Statistical Institute – Bulgarian provinces and municipalities in 2009 Archived November 13, 2010, at the Wayback Machine
- (in English) Bulgarian National Statistical Institute – Bulgarian towns in 2009 Archived November 13, 2010, at the Wayback Machine
- (in English) Bulgarian National Statistical Institute – Bulgarian villages under 1000 inhabitants – December 2009
- (in English) Bulgarian National Statistical Institute – Bulgarian Settlements 1000–5000 inhabitants – December 2009
- National Statistical Institute – Census 2001
- „pop-stat.mashke.org“
- "Population of Bulgarian divisions". Pop-stat.mashke.org. February 1, 2011. Retrieved March 28, 2012.
- "Religious composition of Bulgaria 2011". pop-stat.mashke.org.
External links
- Official website (in Bulgarian)
Places adjacent to Glavinitsa Municipality | ||||||||||
|---|---|---|---|---|---|---|---|---|---|---|
| ||||||||||