Graphical timeline of the universe
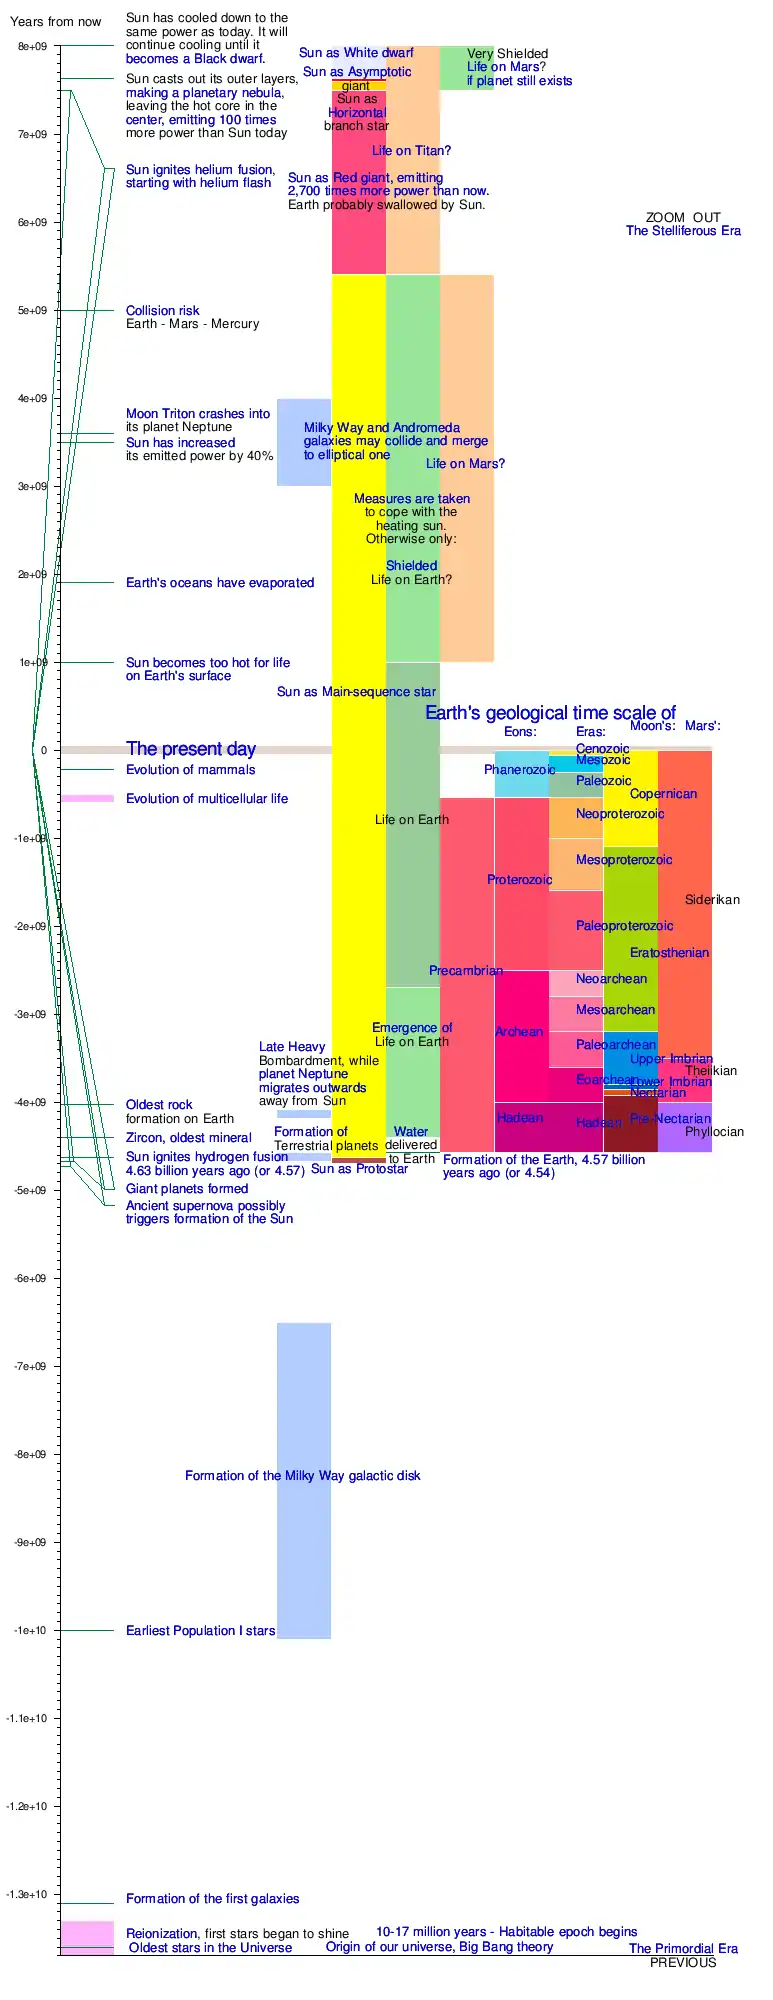
This more than 20-billion-year timeline of our universe shows the best estimates of major events from the universe's beginning to anticipated future events. Zero on the scale is the present day. A large step on the scale is one billion years; a small step, one hundred million years. The past is denoted by a minus sign: e.g., the oldest rock on Earth was formed about four billion years ago and this is marked at -4e+09 years, where 4e+09 represents 4 times 10 to the power of 9. The "Big Bang" event most likely happened 13.8 billion years ago; see age of the universe.
See also
- Cosmic Calendar (age of the universe scaled to a single year)
- Formation and evolution of the Solar System
- Graphical timeline from Big Bang to Heat Death
- Graphical timeline of the Big Bang
- Graphical timeline of the Stelliferous Era.
- Timeline of cosmological epochs
This article is issued from Wikipedia. The text is licensed under Creative Commons - Attribution - Sharealike. Additional terms may apply for the media files.