List of places in Victoria by population
This is a list of places in the Australian state of Victoria by population.
Urban centres are defined by the Australian Bureau of Statistics as being a population cluster of 1,000 or more people. The below figures broadly represent the populations of the contiguous built-up areas of each city.[1]
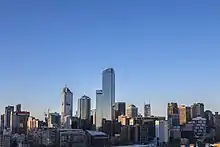
Melbourne, the most populated city in Victoria.

Looking east over Sturt Street and the CBD toward Bridge Mall from Ballarat Town Hall clock tower
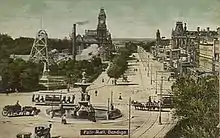
Pall Mall and Charing Cross in 1909. Bendigo had become a bustling city with a large transport network.
| Rank | Urban centre | Population | |||||
|---|---|---|---|---|---|---|---|
| 2001 census[2] | 2006 census[3] | 2011 census[4] | 2016 census[5] | 2018-2020 estimate | With Neighboring NSW Towns (latest) | ||
| 1 | Melbourne | 3,338,704 | 3,375,341 | 3,707,530 | 4,196,201 | 5,078,193 | |
| 2 | Geelong | 129,668 | 135,965 | 143,921 | 157,103 | 263,280 | |
| 3 | Ballarat | 72,766 | 77,766 | 85,936 | 93,761 | 105,471 | |
| 4 | Bendigo | 68,480 | 75,420 | 82,795 | 92,384 | 99,122 | |
| 5 | Melton | 32,007 | 35,194 | 45,625 | 54,455 | 72,177 | |
| 6 | Mildura | 27,963 | 30,761 | 31,363 | 33,445 | 51,903 | |
| 7 | Shepparton - Mooroopna | 35,754 | 38,247 | 42,742 | 46,194 | 51,631 | |
| – | Pakenham | 11,283 | 18,621 | 32,913 | N/A[note 1] | 90,000 | |
| 8 | Wodonga | 27,659 | 29,538 | 31,605 | 35,131 | 43,141 | est. 84,303 (w/ Albury) |
| 9 | Sunbury | 25,086 | 29,071 | 33,062 | 34,425 | 41,340 | |
| 10 | Warrnambool | 26,669 | 28,015 | 29,286 | 30,707 | 35,523 | |
| 11 | Traralgon | 19,569 | 21,474 | 24,590 | 25,482 | 27,958 | |
| 12 | Wangaratta | 16,310 | 16,732 | 17,376 | 18,567 | 19,411 | |
| 13 | Ocean Grove - Barwon Heads | 12,582 | 13,701 | 16,091 | 18,208 | 20,805 | |
| 14 | Bacchus Marsh | 12,107 | 13,046 | 14,914 | 17,303 | 22,964 | |
| 15 | Torquay - Jan Juc | 7,943 | 9,463[note 2] | 13,336 | 16,942 | 20,167 | |
| 16 | Horsham | 13,210 | 13,945 | 15,261 | 15,630 | 16,589 | |
| 17 | Moe - Newborough | 15,352[note 3] | 15,159[note 4] | 15,293 | 15,062 | 16,821 | |
| 18 | Warragul | 10,405 | 11,333 | 13,081 | 14,274 | 15,757 | |
| 19 | Morwell | 13,505 | 13,399 | 13,689 | 13,540 | 14,026 | |
| 20 | Sale | 12,793 | 13,090 | 12,764 | 13,507 | 15,135 | |
| 21 | Lara | 9,185 | 10,312 | 11,192 | 13,327 | 17,936 | |
| 22 | Bairnsdale | 10,557 | 11,033 | 11,820 | 12,950 | 15,565 | |
| 23 | Echuca | 10,926 | 12,399 | 12,611 | 12,902 | 14,920 | 20,493 (w/ Moama) |
| 24 | Drysdale - Clifton Springs | 9,007 | 9,880 | 10,929 | 12,483 | 14,895 | |
| 25 | Colac | 10,164 | 10,560 | 11,416 | 11,890 | 12,574 | |
| 26 | Drouin | 5,800 | 6,656 | 9,369 | 11,889 | 12,349 | |
| 27 | Leopold | 6,722 | 7,937 | 9,608 | 11,882 | 13,387 | |
| 28 | Swan Hill | 9,738 | 9,705 | 9,876 | 10,603 | 11,089 | |
| 29 | Portland | 9,566 | 9,708 | 9,959 | 10,059 | 10,928 | |
| 30 | Castlemaine | 6,822 | 7,082 | 9,124 | 9,933 | ||
| 31 | Gisborne | 4,228 | 6,285 | 8,056 | 9,822 | 10,950 | |
| 32 | Benalla | 8,593 | 8,951 | 9,328 | 9,296 | ||
| 33 | Hamilton | 9,119 | 9,493 | 9,344 | 8,892 | ||
| 34 | Wallan | 3,958 | 5,321 | 7,810 | 8,521 | ||
| 35 | Healesville | 7,132 | 7,216 | 7,992 | 8,483 | ||
| 36 | Wonthaggi | 6,136 | 6,362 | 7,279 | 7,917 | ||
| 37 | Yarrawonga | 4,016 | 5,727 | 6,793 | 7,847 | est 10,000 with Mulwala | |
| 38 | Maryborough | 7,471 | 7,549 | 7,174 | 7,495 | ||
| 39 | Kilmore | 3,521 | 4,699 | 6,142 | 6,953 | ||
| 40 | Kyneton | 4,108 | 5,905 | 6,629 | 6,951 | ||
| 41 | Ararat | 7,043 | 7,066 | 7,023 | 6,924 | ||
| 42 | Portarlington - St Leonards | 4,677[note 5] | 4,947[note 5] | 6,069[note 5] | 6,883 | ||
| 43 | Lakes Entrance | 5,476 | 5,644 | 5,967 | 6,071 | ||
| 44 | Kyabram | 5,527 | 5,378 | 5,643 | 5,899 | ||
| 45 | Seymour | 6,422 | 5,915 | 5,915 | 5,842 | ||
| 46 | Stawell | 6,134 | 5,755 | 5,737 | 5,521 | ||
| 47 | Cobram | 4,543 | 4,995 | 5,420 | 5,376 | ||
| 48 | Irymple | N/A | 5,740 | 5,015 | 5,325 | ||
| 49 | Leongatha | 4,220 | 4,306 | 4,894 | 5,117 | ||
| 50 | Inverloch | 3,737 | 3,532 | 4,456 | 5,066 | ||
| 51 | Red Cliffs | 2,629 | 4,596 | 4,625 | 5,060 | ||
| 52 | Bannockburn | 1,518 | 2,426 | 3,512 | 4,997 | 7,467 | |
| 53 | Cowes | 3,494 | 4,137 | 4,310 | 4,944 | ||
- Notes
- Due to increased residential development in Officer, which previously provided a non-urban buffer between Pakenham and the rest of the Melbourne metropolitan area, Pakenham began to be counted as part of the greater Melbourne urban centre starting from the 2016 census.
- This figure is for Torquay only.
- This figure is for Moe - Yallourn.
- This figure is for Moe - Yallourn.
- This figure is the sum of the populations of Portarlington, Indented Head and St Leonards, which were treated as three neighbouring but distinct urban centres prior to the 2016 census.
See also
References
- "Urban Centre and Locality - Australian Statistical Geography Standard (ASGS)". Australian Bureau of Statistics. 2017-10-19. Retrieved 2018-01-19.
- Australian Bureau of Statistics TableBuilder: 2001 Census - Persons in Dwellings - persons counted by Urban Centres/Localities
- Australian Bureau of Statistics TableBuilder: 2006 Census - Persons in Dwellings - persons counted by Urban Centres/Localities
- Australian Bureau of Statistics TableBuilder: 2011 Census - Persons and Relationships - persons counted by Urban Centres and Localities
- Australian Bureau of Statistics TableBuilder: 2016 Census - Cultural Diversity - Persons (Place of Usual Residence) counted by Urban Centres and Localities
| ||||||||||||||
This article is issued from Wikipedia. The text is licensed under Creative Commons - Attribution - Sharealike. Additional terms may apply for the media files.