List of places in South Australia by population
This is a list of cities/towns in South Australia by urban centre population.
Largest urban centres or localities by population
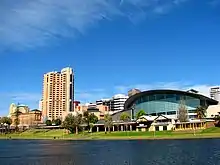
Adelaide
State capital
State capital
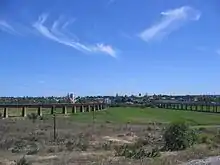
Murray Bridge in the distance
.jpg.webp)
View from Hummock Hill, Whyalla
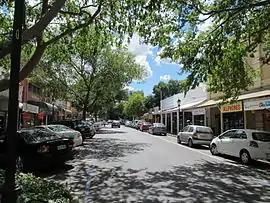
Gawler St, Mt Barker
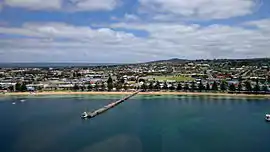
Aerial view of Port Lincoln
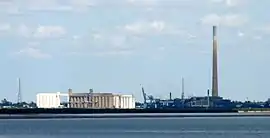
View of Port Pirie
Urban centres are defined by the Australian Bureau of Statistics as being a population cluster of 1,000 or more people.[1] For statistical purposes, people living in urban centres are classified as urban. These figures represent the populations of the contiguous built-up areas of each city.
Suburbs of Adelaide are not included, with the exception of Gawler, Mount Barker, Crafers-Bridgewater and Nairne, which can all be seen as semi-rural suburbs but also as separate towns.
| Rank | Urban centre | Population 2001 Census |
Population 2006 Census |
Population 2011 Census |
Population 2016 Census |
|---|---|---|---|---|---|
| 1 | Adelaide | 1,066,103 | 1,040,719 | 1,103,979 | 1,165,632 |
| 2 | Gawler | 16,779 | 20,006 | 23,957 | 26,472 |
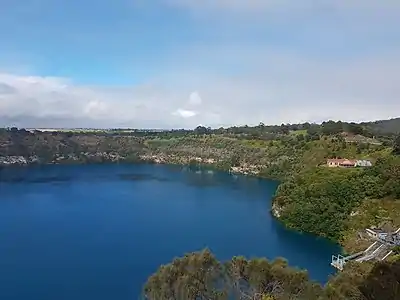
| 3 | Mount Gambier | 22,656, | 23,494 | 25,199 | 26,148 |
| 4 | Whyalla | 21,211 | 21,122 | 21,736 | 21,501 |
| 5 | Murray Bridge | 12,998 | 14,048 | 15,967 | 16,804 |
| 6 | Mount Barker | 9,116 | 11,540 | 14,452 | 16,629 |
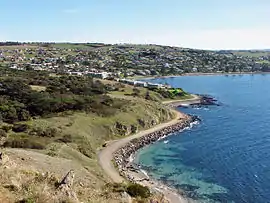
| 7 | Victor Harbor | 8,923 | 10,380 | 13,411 | 15,265 |
| 8 | Crafers-Bridgewater | 13,130 | 13,375 | 14,617 | 15,125 |
| 9 | Port Lincoln | 12,630 | 13,044 | 14,088 | 14,064 |
| 10 | Port Pirie | 13,254 | 13,206 | 13,819 | 13,740 |
| 11 | Port Augusta | 13,153 | 13,257 | 13,504 | 12,896 |
| 12 | Goolwa | 4,327 | 5,882 | 6,385 | 7,717 |
| 13 | Nuriootpa | 3,846 | 4,414 | 5,215 | 5,691 |
| 14 | Strathalbyn | 3,204 | 3,894 | 5,292 | 5,486 |
| 15 | Naracoorte | 4,745 | 4,888 | 4,908 | 5,074 |
| 16 | Nairne | 2,770 | 3,470 | 4,198 | 4,842 |
| 17 | Millicent | 4,430 | 4,771 | 4,798 | 4,734 |
| 18 | Renmark | 4,448 | 4,339 | 4,387 | 4,634 |
| 19 | Kadina | 3,742 | 4,026 | 4,470 | 4,587 |
| 20 | Tanunda | 3,836 | 4,153 | 4,214 | 4,324 |
| 21 | Moonta | 3,068 | 3,350 | 3,659 | 4,174 |
| 22 | Berri | 4,214 | 4,008 | 4,103 | 4,088 |
| 23 | Wallaroo | 2,710 | 3,053 | 3,795 | 3,988 |
| 24 | Loxton | 3,352 | 3,431 | 3,795 | 3,588 |
| 25 | Roxby Downs | 3,608 | 3,847 | 4,702 | 3,588 |
| 26 | Clare | 2,921 | 3,063 | 3,278 | 3,327 |
| 27 | McLaren Vale | 2,584 | 2,908 | 3,043 | 3,096 |
| 28 | Angle Vale | 1,229 | 1,359 | 2,363 | 2,818 |
| 29 | Bordertown | 2,440 | 2,581 | 2,549 | 2,669 |
| 30 | Kapunda | 2,301 | 2,480 | 2,484 | 2,598 |
| 31 | Mannum | 2,189 | 2,042 | 2,164 | 2,398 |
| 32 | Hahndorf | 1,836 | 1,805 | 2,092 | 2,180 |
| 33 | Williamstown | 1,280 | 1,432 | 1,882 | 2,163 |
| 34 | Ceduna | 2,564 | 2,304 | 2,289 | 2,157 |
| 35 | Willunga | 1,894 | 2,104 | 2,094 | 2,143 |
| 36 | Lobethal | 1,679 | 1,836 | 1,957 | 2,135 |
| 37 | Freeling | 1,137 | 1,325 | 1,591 | 2,052 |
| 38 | Angaston | 1,930 | 1,865 | 1,940 | 2,044 |
| 39 | Barmera | 1,942 | 1,928 | 1,914 | 1,935 |
| 40 | Two Wells | 634 | 717 | 1,764 | 1,926 |
| 41 | Normanville | 1,012 | 1,303 | 1,637 | 1,906 |
| 42 | Balaklava | 1,531 | 1,626 | 1,827 | 1,902 |
| 43 | Woodside | 1,565 | 1,826 | 1,842 | 1,870 |
| 44 | Lyndoch | 1,245 | 1,415 | 1,618 | 1,799 |
| 45 | Kingscote | 1,671 | 1,692 | 1,763 | 1,790 |
| 46 | Kingston SE | 1,475 | 1,630 | 1,612 | 1,648 |
| 47 | Waikerie | 1,769 | 1,744 | 1,633 | 1,632 |
| 48 | Coober Pedy | 2,438 | 1,472 | 1,584 | 1,625 |
| 49 | Lewiston | 2,059 | 2,742 | 1,545 | 1,589 |
| 50 | Balhannah | 1,488 | 1,501 | 1,597 | 1,546 |
| 51 | Tumby Bay | 1,223 | 1,351 | 1,474 | 1,417 |
| 52 | Peterborough | 1,679 | 1,689 | 1,486 | 1,416 |
| 53 | Tailem Bend | 1,391 | 1,457 | 1,405 | 1,410 |
| 54 | Jamestown | 1,356 | 1,407 | 1,406 | 1,392 |
| 55 | Crystal Brook | 1,266 | 1,185 | 1,278 | 1,324 |
| 56 | Penola | 1,219 | 1,317 | 1,337 | 1,312 |
| 57 | Ardrossan | 1,078 | 1,122 | 1,136 | 1,167 |
| 58 | Quorn | 988 | 1,068 | 1,206 | 1,131 |
| 59 | McLaren Flat | N/A | 642 | 1,034 | 1,121 |
| 60 | Mount Compass | 498 | 695 | 1,042 | 1,119 |
| 61 | Keith | 1,130 | 1,089 | 1,069 | 1,076 |
| 62 | Maitland | 992 | 1,056 | 1047 | 1,029 |
| 63 | Port Broughton | 725 | 908 | 982 | 1,036 |
25 largest local government areas by population
Local government areas are the main units of local government in Australia. They may be termed cities, shires, councils or other names, but they all function similarly.
| Rank | Local government area | Population 2016 census |
Population 2018 estimate[2] |
Growth rate |
Stat. division/district |
|---|---|---|---|---|---|
| 1. | City of Onkaparinga | 166,766 | 171,489 | 2.8% | Adelaide |
| 2. | City of Salisbury | 137,979 | 142,555 | 3.3% | Adelaide |
| 3. | City of Port Adelaide Enfield | 121,230 | 126,120 | 4.0% | Adelaide |
| 4. | City of Charles Sturt | 111,759 | 117,382 | 5.0% | Adelaide |
| 5. | City of Tea Tree Gully | 97,734 | 99,694 | 2.0% | Adelaide |
| 6. | City of Playford | 90,669 | 93,426 | 3.0% | Adelaide |
| 7. | City of Marion | 88,618 | 92,308 | 4.2% | Adelaide |
| 8. | City of Mitcham | 66,834 | 67,253 | 0.6% | Adelaide |
| 9. | City of West Torrens | 57,901 | 60,105 | 3.8% | Adelaide |
| 10. | City of Campbelltown | 50,164 | 51,469 | 2.6% | Adelaide |
| 11. | City of Burnside | 43,911 | 45,706 | 4.1% | Adelaide |
| 12. | Adelaide Hills Council | 38,863 | 39,794 | 2.4% | Adelaide |
| 13. | City of Unley | 37,721 | 39,145 | 3.8% | Adelaide |
| 14. | City of Holdfast Bay | 36,681 | 37,032 | 1.0% | Adelaide |
| 15. | City of Norwood Payneham & St Peters | 35,362 | 36,750 | 3.9% | Adelaide |
| 16. | District Council of Mount Barker | 33,397 | 35,545 | 6.4% | Adelaide |
| 17. | City of Mount Gambier | 26,276 | 27,176 | 3.4% | Mount Gambier |
| 18. | Alexandrina Council | 25,873 | 27,037 | 4.5% | Alexandrina |
| 19. | Barossa Council | 23,558 | 24,808 | 5.3% | Barossa |
| 20. | City of Adelaide | 22,063 | 24,794 | 12.3% | Adelaide |
| 21. | Town of Gawler | 23,034 | 24,018 | 4.3% | Gawler |
| 22. | Rural City of Murray Bridge | 20,858 | 22,165 | 6.3% | Murray Bridge |
| 23. | City of Whyalla | 21,828 | 21,766 | -0.3% | Whyalla |
| 24. | City of Prospect | 20,527 | 21,259 | 3.6% | Adelaide |
| 25. | Port Pirie Regional Council | 17,364 | 17,630 | 1.5% | Port Pirie |
See also
Notes and references
- "Urban Centres and Localities (UCLs) and Significant Urban Areas (SUAs)" (PDF). Australian Bureau of Statistics. Retrieved 10 January 2014.
- "3218.0 – Regional Population Growth, Australia, 2017-18". Australian Bureau of Statistics. 27 March 2019. Retrieved 31 December 2019. Estimated resident population (ERP) at 30 June 2018.
| ||||||||||||||
This article is issued from Wikipedia. The text is licensed under Creative Commons - Attribution - Sharealike. Additional terms may apply for the media files.