Manapla
Manapla, officially the Municipality of Manapla, is a 2nd class municipality in the province of Negros Occidental, Philippines. According to the 2015 census, it has a population of 54,845 people. [3]
Manapla | |
|---|---|
| Municipality of Manapla | |
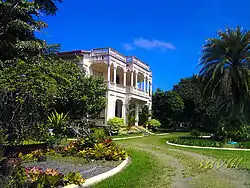 Hacienda Santa Rosalia, Manapla | |
 Seal | |
| Nickname(s): The Negrosanon Top End | |
 Map of Negros Occidental with Manapla highlighted | |
OpenStreetMap 
| |
.svg.png.webp) Manapla Location within the Philippines | |
| Coordinates: 10°57′29″N 123°07′23″E | |
| Country | |
| Region | Western Visayas (Region VI) |
| Province | Negros Occidental |
| District | 2nd District |
| Barangays | 12 (see Barangays) |
| Government | |
| • Type | Sangguniang Bayan |
| • Mayor | Manuel M. Escalante III |
| • Vice Mayor | Edgar B. Pagayonan |
| • Representative | Leo Rafael M. Cueva |
| • Electorate | 31,977 voters (2019) |
| Area | |
| • Total | 112.86 km2 (43.58 sq mi) |
| Elevation | 10 m (30 ft) |
| Population | |
| • Total | 54,845 |
| • Density | 490/km2 (1,300/sq mi) |
| • Households | 12,254 |
| Economy | |
| • Income class | 2nd municipal income class |
| • Poverty incidence | 21.86% (2015)[4] |
| • Revenue | ₱132,206,986.43 (2016) |
| Time zone | UTC+8 (PST) |
| ZIP code | 6120 |
| PSGC | |
| IDD : area code | +63 (0)34 |
| Climate type | tropical climate |
| Native languages | Hiligaynon Tagalog |
Barangays
Manapla is politically subdivided into 12 barangays.
Climate
| Climate data for Manapla, Negros Occidental | |||||||||||||
|---|---|---|---|---|---|---|---|---|---|---|---|---|---|
| Month | Jan | Feb | Mar | Apr | May | Jun | Jul | Aug | Sep | Oct | Nov | Dec | Year |
| Average high °C (°F) | 28 (82) |
29 (84) |
30 (86) |
32 (90) |
32 (90) |
31 (88) |
30 (86) |
29 (84) |
29 (84) |
29 (84) |
29 (84) |
28 (82) |
30 (85) |
| Average low °C (°F) | 23 (73) |
23 (73) |
23 (73) |
24 (75) |
25 (77) |
25 (77) |
25 (77) |
24 (75) |
24 (75) |
24 (75) |
24 (75) |
23 (73) |
24 (75) |
| Average precipitation mm (inches) | 57 (2.2) |
37 (1.5) |
41 (1.6) |
42 (1.7) |
98 (3.9) |
155 (6.1) |
187 (7.4) |
162 (6.4) |
179 (7.0) |
188 (7.4) |
114 (4.5) |
78 (3.1) |
1,338 (52.8) |
| Average rainy days | 12.0 | 7.7 | 9.2 | 10.2 | 19.5 | 24.6 | 26.9 | 25.1 | 25.5 | 25.2 | 18.0 | 13.0 | 216.9 |
| Source: Meteoblue [6] | |||||||||||||
Demographics
| Year | Pop. | ±% p.a. |
|---|---|---|
| 1903 | 10,123 | — |
| 1918 | 10,033 | −0.06% |
| 1939 | 19,490 | +3.21% |
| 1948 | 35,218 | +6.79% |
| 1960 | 46,809 | +2.40% |
| 1970 | 31,097 | −4.00% |
| 1975 | 38,357 | +4.30% |
| 1980 | 40,524 | +1.10% |
| 1990 | 40,095 | −0.11% |
| 1995 | 44,301 | +1.89% |
| 2000 | 49,581 | +2.44% |
| 2007 | 52,428 | +0.77% |
| 2010 | 52,687 | +0.18% |
| 2015 | 54,845 | +0.77% |
| Source: Philippine Statistics Authority [3] [7] [8][9] | ||
References
- Municipality of Manapla | (DILG)
- "Province:". PSGC Interactive. Quezon City, Philippines: Philippine Statistics Authority. Retrieved 12 November 2016.
- Census of Population (2015). "Region VI (Western Visayas)". Total Population by Province, City, Municipality and Barangay. PSA. Retrieved 20 June 2016.
- "PSA releases the 2015 Municipal and City Level Poverty Estimates". Quezon City, Philippines. Retrieved 12 October 2019.
- Choose Philippines powered by Philippine Department of Tourism
- "Manapla: Average Temperatures and Rainfall". Meteoblue. Retrieved 7 May 2020.
- Census of Population and Housing (2010). "Region VI (Western Visayas)". Total Population by Province, City, Municipality and Barangay. NSO. Retrieved 29 June 2016.
- Censuses of Population (1903–2007). "Region VI (Western Visayas)". Table 1. Population Enumerated in Various Censuses by Province/Highly Urbanized City: 1903 to 2007. NSO.
- "Province of". Municipality Population Data. Local Water Utilities Administration Research Division. Retrieved 17 December 2016.
External links
 Media related to Manapla, Negros Occidental at Wikimedia Commons
- Manapla Profile at PhilAtlas.com
- Philippine Standard Geographic Code
- Philippine Census Information
- Local Governance Performance Management System
Places adjacent to Manapla | ||||||||||
|---|---|---|---|---|---|---|---|---|---|---|
| ||||||||||
Bacolod (capital) | |
| Municipalities | |
| Component cities | |
| Highly urbanized city |
|
This article is issued from Wikipedia. The text is licensed under Creative Commons - Attribution - Sharealike. Additional terms may apply for the media files.
