Maragle, New South Wales
Maragle is a rural locality in the southeast part of the Riverina, situated approximately 22 kilometres (14 mi) west of Cabramurra as the crow flies, or 53 kilometres (33 mi) by road. The nearest towns are Tumbarumba 16 kilometres (9.9 mi) to the northwest, and Batlow 37 kilometres (23 mi) to the north. At the 2016 census, it had a population of 58.[1]
| Maragle New South Wales | |||||||||
|---|---|---|---|---|---|---|---|---|---|
%253B_Oct_2019.jpeg.webp) Maragle State Forest along the Elliott Way, at an elevation of 1,200 metres (3,900 ft) | |||||||||
Maragle | |||||||||
| Coordinates | 35°53′54″S 148°09′04″E | ||||||||
| Population | 58 (2016 census)[1] | ||||||||
| Postcode(s) | 2653 | ||||||||
| Elevation | 600–1,375 m (1,969–4,511 ft) | ||||||||
| Location |
| ||||||||
| LGA(s) | Snowy Valleys Council | ||||||||
| County | Selwyn | ||||||||
| State electorate(s) | Albury | ||||||||
| Federal Division(s) | Eden-Monaro | ||||||||
| |||||||||
Geography
The region varies greatly in altitude and topography, ranging from 600 metres (2,000 ft) to 1,375 metres (4,511 ft) AMSL at Pilot Reef Mountain.[2] State forest (chiefly Eucalyptus delegatensis and pinus radiata) as well as semi-cleared, undulating grazing land characterise the area. Common large faunae in the Maragle State Forest include deer and brumbies.
 The lower plains are characterised by slightly undulating, highly arable land, most suited to lambing due to a relative lack of particularly cold weather.
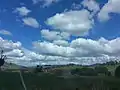
Climate
Owing to its windward position astride the South West Slopes, the region experiences an extreme amount of precipitation during winter and spring, averaging 1,577.4 millimetres (62.10 in) annually; of which a large quantity falls as heavy snow at higher elevations. Summers are warm and relatively dry, although with severe thunderstorms.
Climate data is sourced from an altitude of 971 metres (3,186 ft) at Kunama.[3]
| Climate data for Kunama (1946–1957); 971 m AMSL; 35° 33′ 00.00″ S | |||||||||||||
|---|---|---|---|---|---|---|---|---|---|---|---|---|---|
| Month | Jan | Feb | Mar | Apr | May | Jun | Jul | Aug | Sep | Oct | Nov | Dec | Year |
| Average high °C (°F) | 24.7 (76.5) |
24.0 (75.2) |
21.5 (70.7) |
15.7 (60.3) |
11.2 (52.2) |
7.9 (46.2) |
7.2 (45.0) |
8.4 (47.1) |
12.5 (54.5) |
14.4 (57.9) |
17.7 (63.9) |
22.2 (72.0) |
15.6 (60.1) |
| Average low °C (°F) | 10.6 (51.1) |
11.3 (52.3) |
9.6 (49.3) |
5.8 (42.4) |
3.3 (37.9) |
1.3 (34.3) |
0.3 (32.5) |
0.5 (32.9) |
2.6 (36.7) |
4.6 (40.3) |
6.1 (43.0) |
9.2 (48.6) |
5.4 (41.8) |
| Average precipitation mm (inches) | 66.9 (2.63) |
67.5 (2.66) |
116.6 (4.59) |
118.2 (4.65) |
169.1 (6.66) |
173.2 (6.82) |
173.8 (6.84) |
148.9 (5.86) |
125.9 (4.96) |
205.8 (8.10) |
138.4 (5.45) |
73.1 (2.88) |
1,577.4 (62.1) |
| Average precipitation days (≥ 0.2 mm) | 6.0 | 6.5 | 7.6 | 11.8 | 13.1 | 15.5 | 14.2 | 17.3 | 10.4 | 16.8 | 11.5 | 8.4 | 139.1 |
| Source: Australian Bureau of Meteorology; Kunama | |||||||||||||
Hunters Hill
More recent climate data are found at Hunters Hill (981 m), across the border into Victoria. Minima have warmed significantly since Kunama's 1946–1957; due to less evaporative cooling as a result of lighter rainfall from cold fronts (as opposed to heavy showers), and thus lower snow cover.
| Climate data for Hunters Hill (1993–2020); 981 m AMSL; 36° 12′ 38.96″ S | |||||||||||||
|---|---|---|---|---|---|---|---|---|---|---|---|---|---|
| Month | Jan | Feb | Mar | Apr | May | Jun | Jul | Aug | Sep | Oct | Nov | Dec | Year |
| Record high °C (°F) | 38.8 (101.8) |
36.9 (98.4) |
32.8 (91.0) |
26.2 (79.2) |
21.3 (70.3) |
16.2 (61.2) |
13.8 (56.8) |
18.4 (65.1) |
24.5 (76.1) |
28.6 (83.5) |
33.3 (91.9) |
36.0 (96.8) |
38.8 (101.8) |
| Average high °C (°F) | 26.2 (79.2) |
25.3 (77.5) |
21.8 (71.2) |
16.6 (61.9) |
11.8 (53.2) |
8.5 (47.3) |
7.4 (45.3) |
8.9 (48.0) |
12.3 (54.1) |
16.3 (61.3) |
19.9 (67.8) |
23.2 (73.8) |
16.5 (61.7) |
| Average low °C (°F) | 14.6 (58.3) |
14.0 (57.2) |
11.6 (52.9) |
8.5 (47.3) |
5.4 (41.7) |
3.1 (37.6) |
2.0 (35.6) |
2.5 (36.5) |
4.5 (40.1) |
7.2 (45.0) |
10.1 (50.2) |
12.2 (54.0) |
8.0 (46.4) |
| Record low °C (°F) | 3.0 (37.4) |
2.3 (36.1) |
1.6 (34.9) |
−0.3 (31.5) |
−2.1 (28.2) |
−2.2 (28.0) |
−6.7 (19.9) |
−3.1 (26.4) |
−4.1 (24.6) |
−1.4 (29.5) |
−1.0 (30.2) |
0.8 (33.4) |
−6.7 (19.9) |
| Average precipitation mm (inches) | 65.1 (2.56) |
71.2 (2.80) |
70.4 (2.77) |
75.2 (2.96) |
99.7 (3.93) |
133.2 (5.24) |
150.7 (5.93) |
137.4 (5.41) |
113.8 (4.48) |
86.6 (3.41) |
91.2 (3.59) |
77.2 (3.04) |
1,187.4 (46.75) |
| Average precipitation days (≥ 0.2 mm) | 8.0 | 7.7 | 7.6 | 8.3 | 11.3 | 14.4 | 18.5 | 16.0 | 13.7 | 10.9 | 10.4 | 8.7 | 135.5 |
| Source: Australian Bureau of Meteorology; Hunters Hill | |||||||||||||
References
- Australian Bureau of Statistics (27 June 2017). "Maragle". 2016 Census QuickStats. Retrieved 6 June 2020.

- "Pilot Reef Mountain". bonzle.com.
- "Kunama climate, averages and extreme weather records". weatherzone.com.au. Retrieved 4 June 2020.