Mean absolute error
In statistics, mean absolute error (MAE) is a measure of errors between paired observations expressing the same phenomenon. Examples of Y versus X include comparisons of predicted versus observed, subsequent time versus initial time, and one technique of measurement versus an alternative technique of measurement. MAE is calculated as:

It is thus an arithmetic average of the absolute errors , where is the prediction and the true value. Note that alternative formulations may include relative frequencies as weight factors. The mean absolute error uses the same scale as the data being measured. This is known as a scale-dependent accuracy measure and therefore cannot be used to make comparisons between series using different scales.[2] The mean absolute error is a common measure of forecast error in time series analysis,[3] sometimes used in confusion with the more standard definition of mean absolute deviation. The same confusion exists more generally.


Quantity disagreement and allocation disagreement
It is possible to express MAE as the sum of two components: Quantity Disagreement and Allocation Disagreement. Quantity Disagreement is the absolute value of the Mean Error given by:

Allocation Disagreement is MAE minus Quantity Disagreement.
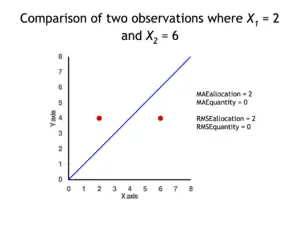
It is also possible to identify the types of difference by looking at an plot. Quantity difference exists when the average of the X values does not equal the average of the Y values. Allocation difference exists if and only if points reside on both sides of the identity line.[4][5]

Related measures
The mean absolute error is one of a number of ways of comparing forecasts with their eventual outcomes. Well-established alternatives are the mean absolute scaled error (MASE) and the mean squared error. These all summarize performance in ways that disregard the direction of over- or under- prediction; a measure that does place emphasis on this is the mean signed difference.
Where a prediction model is to be fitted using a selected performance measure, in the sense that the least squares approach is related to the mean squared error, the equivalent for mean absolute error is least absolute deviations.
MAE is not identical to RMSE (root-mean square error), but some researchers report and interpret RMSE as if RMSE reflects the measurement that MAE gives. MAE is conceptually simpler and more interpretable than RMSE. MAE does not require the use of squares or square roots. The use of squared distances hinders the interpretation of RMSE. MAE is simply the average absolute vertical or horizontal distance between each point in a scatter plot and the Y=X line. In other words, MAE is the average absolute difference between X and Y. MAE is fundamentally easier to understand than the square root of the average of the squared deviations. Furthermore, each error contributes to MAE in proportion to the absolute value of the error, which is not true for RMSE; because RMSE involves squaring the difference between the X and Y, a few large differences will increase the RMSE to a greater degree than the MAE.[4] See the example above for an illustration of these differences.
Optimality property
The mean absolute error of a real variable c with respect to the random variable X is

Provided that the probability distribution of X is such that the above expectation exists, then m is a median of X if and only if m is a minimizer of the mean absolute error with respect to X.[6] In particular, m is a sample median if and only if m minimizes the arithmetic mean of the absolute deviations.[7]
More generally, a median is defined as a minimum of

as discussed at Multivariate median (and specifically at Spatial median).
This optimization-based definition of the median is useful in statistical data-analysis, for example, in k-medians clustering.
Proof of optimality
Statement: The classifier minimising is .


Proof:
The Loss functions for classification is

Differentiating wrt a gives

This means

Hence

See also
References
- Willmott, Cort J.; Matsuura, Kenji (December 19, 2005). "Advantages of the mean absolute error (MAE) over the root mean square error (RMSE) in assessing average model performance". Climate Research. 30: 79–82. doi:10.3354/cr030079.
- "2.5 Evaluating forecast accuracy | OTexts". www.otexts.org. Retrieved 2016-05-18.
- Hyndman, R. and Koehler A. (2005). "Another look at measures of forecast accuracy"
- Pontius Jr., Robert Gilmore; Thontteh, Olufunmilayo; Chen, Hao (2008). "Components of information for multiple resolution comparison between maps that share a real variable". Environmental and Ecological Statistics. 15 (2): 111–142. doi:10.1007/s10651-007-0043-y.
- Willmott, C. J.; Matsuura, K. (January 2006). "On the use of dimensioned measures of error to evaluate the performance of spatial interpolators". International Journal of Geographical Information Science. 20: 89–102. doi:10.1080/13658810500286976.
- Stroock, Daniel (2011). Probability Theory. Cambridge University Press. pp. 43. ISBN 978-0-521-13250-3.
- Nicolas, André (2012-02-25). "The Median Minimizes the Sum of Absolute Deviations (The $ {L}_{1} $ Norm)". StackExchange.
