Michigan's 12th congressional district
Michigan's 12th congressional district is a U.S. congressional district in Michigan, which under its current borders stretches from Detroit's western suburbs to Ann Arbor.[3]
| Michigan's 12th congressional district | |||
|---|---|---|---|
.tif.png.webp) Michigan's 12th congressional district since January 3, 2013 | |||
| Representative |
| ||
| Population (2019) | 704,912 | ||
| Median household income | $62,253[1] | ||
| Ethnicity |
| ||
| Cook PVI | D+14[2] | ||
The district was first created during the reapportionment and redistricting after the 1890 Census. From 2003 to 2013 it was located in Detroit's inner suburbs to the north, along the Interstate 696 corridor in Macomb and Oakland counties, as well as a portion of Macomb north of the corridor. District boundaries were redrawn in 1993, and 2003 due to reapportionment following the censuses of 1990 and 2000.[4]
During the 113th Congress (2013 to 2015), the district was represented by John Dingell (D). He was a Congressman for this and other districts for a total of 59 years, making him the longest-serving member of Congress in US history. He was succeeded by his wife Debbie Dingell, who currently represents the district.[3]
Major cities
Under its borders from 2013 to 2023,[5] the district includes the following major cities:
- Allen Park
- Ann Arbor
- Belleville
- Dearborn
- Flat Rock (the portion in Wayne County)
- Grosse Ile
- Lincoln Park
- Pittsfield Township
- Riverview
- Rockwood
- Superior Township
- Taylor
- Trenton
- Woodhaven
- Wyandotte
- Ypsilanti
Election results from presidential races
In recent times,[6][7] the district has voted consistently for the Democratic Party candidate in presidential races.
| Year | Winner | Margin |
|---|---|---|
| 1992 | B. Clinton | 42 - 40% |
| 1996 | B. Clinton | 52 - 38% |
| 2000 | Gore | 61 - 37% |
| 2004 | Kerry | 61 - 39% |
| 2008 | Obama | 65 - 33% |
| 2012 | Obama | 66 - 33% |
| 2016 | H. Clinton | 61 - 35% |
| 2020 | Biden | 64 - 34% |
Election results from statewide races
| Election results from statewide races | ||
|---|---|---|
| Year | Office | Results |
| 2018 | Senate | Stabenow 66 - 32% |
| 2018 | Governor | Whitmer 67 - 30% |
List of members representing the district
| Representative | Party | Years | Congress | Electoral history |
|---|---|---|---|---|
| District created March 4, 1893 | ||||
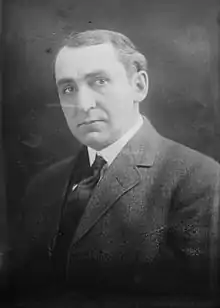
.jpg.webp) Samuel M. Stephenson |
Republican | March 4, 1893 – March 3, 1897 |
53rd 54th |
Redistricted from the 11th district and re-elected in 1892 Re-elected in 1894. |
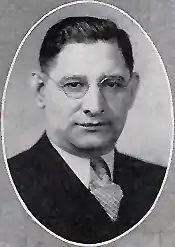
.jpg.webp) Carlos D. Shelden |
Republican | March 4, 1897 – March 3, 1903 |
55th 56th 57th |
Elected in 1896. Re-elected in 1898. Re-elected in 1900. Lost renomination. |
.jpg.webp) H. Olin Young |
Republican | March 4, 1903 – May 16, 1913 |
58th 59th 60th 61st 62nd 63rd |
Elected in 1902. Re-elected in 1904. Re-elected in 1906. Re-elected in 1908. Re-elected in 1910. Resigned while a contest for the seat was pending. Lost election contest. |
| Vacant | May 16, 1913 – August 26, 1913 |
63rd | Due to a mistake in how the name of William J. MacDonald appeared on the ballot in Ontonagon County some votes were not included in the official count by the state board of canvassers, even though their inclusion in unofficial returns showed MacDonald had won. Subsequently, the United States House Committee on Elections unanimously reported a resolution to the full house awarding the seat to MacDonald. | |
| William J. MacDonald | Progressive | August 26, 1913 – March 3, 1915 |
Won election contest. Lost re-election. | |
 W. Frank James |
Republican | March 4, 1915 – January 3, 1935 |
64th 65th 66th 67th 68th 69th 70th 71st 72nd 73rd |
Elected in 1914. Re-elected in 1916. Re-elected in 1918. Re-elected in 1920. Re-elected in 1922. Re-elected in 1924. Re-elected in 1926. Re-elected in 1928. Re-elected in 1930. Re-elected in 1932. Lost re-election. |
 Frank Hook |
Democratic | January 3, 1935 – January 3, 1943 |
74th 75th 76th 77th |
Elected in 1934. Re-elected in 1936. Re-elected in 1938. Re-elected in 1940. Lost re-election. |
.jpg.webp) John B. Bennett |
Republican | January 3, 1943 – January 3, 1945 |
78th | Elected in 1942. Lost re-election. |
 Frank Hook |
Democratic | January 3, 1945 – January 3, 1947 |
79th | Elected in 1944. Lost re-election. |
.jpg.webp) John B. Bennett |
Republican | January 3, 1947 – August 9, 1964 |
80th 81st 82nd 83rd 84th 85th 86th 87th 88th |
Elected in 1946. Re-elected in 1948. Re-elected in 1950. Re-elected in 1952. Re-elected in 1954. Re-elected in 1956. Re-elected in 1958. Re-elected in 1960. Re-elected in 1962. Died. |
| Vacant | August 9, 1964 – January 3, 1965 |
88th | ||
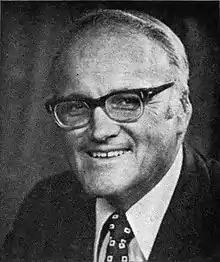
 James G. O'Hara |
Democratic | January 3, 1965 – January 3, 1977 |
89th 90th 91st 92nd 93rd 94th |
Redistricted from the 7th district and re-elected in 1964. Re-elected in 1966. Re-elected in 1968. Re-elected in 1970. Re-elected in 1972. Re-elected in 1974. Retired. |
 David Bonior |
Democratic | January 3, 1977 – January 3, 1993 |
95th 96th 97th 98th 99th 100th 101st 102nd |
Elected in 1976. Re-elected in 1978. Re-elected in 1980. Re-elected in 1982. Re-elected in 1984. Re-elected in 1986. Re-elected in 1988. Re-elected in 1990. Redistricted to the 10th district.. |
 Sander Levin |
Democratic | January 3, 1993 – January 3, 2013 |
103rd 104th 105th 106th 107th 108th 109th 110th 111th 112th |
Redistricted from the 17th district and re-elected in 1992. Re-elected in 1994. Re-elected in 1996. Re-elected in 1998. Re-elected in 2000. Re-elected in 2002. Re-elected in 2004. Re-elected in 2006. Re-elected in 2008. Re-elected in 2010. Redistricted to the 9th district. |
 John Dingell |
Democratic | January 3, 2013 – January 3, 2015 |
113th | Redistricted from the 15th district and re-elected in 2012. Retired. |
 Debbie Dingell |
Democratic | January 3, 2015 – Present |
114th 115th 116th 117th |
Elected in 2014. Re-elected in 2016. Re-elected in 2018. Re-elected in 2020. |
Recent election results
2012
| Party | Candidate | Votes | % | |
|---|---|---|---|---|
| Democratic | John D. Dingell (incumbent) | 216,884 | 67.9 | |
| Republican | Cynthia Kallgren | 92,472 | 29.0 | |
| Libertarian | Richard Secula | 9,867 | 3.1 | |
| Total votes | 319,223 | 100.0 | ||
| Democratic hold | ||||
2014
| Party | Candidate | Votes | % | |
|---|---|---|---|---|
| Democratic | Debbie Dingell | 134,346 | 65.0 | |
| Republican | Terry Bowman | 64,716 | 31.3 | |
| Independent | Gary Walkowicz | 5,039 | 2.4 | |
| Libertarian | Bhagwan Dashairya | 2,559 | 1.3 | |
| Total votes | 206,660 | 100.0 | ||
| Democratic hold | ||||
2016
| Party | Candidate | Votes | % | |
|---|---|---|---|---|
| Democratic | Debbie Dingell (incumbent) | 211,378 | 64.3 | |
| Republican | Jeff Jones | 96,104 | 29.3 | |
| Working Class | Gary Walkowicz | 9,183 | 2.8 | |
| Libertarian | Tom Bagwell | 7,489 | 2.3 | |
| Green | Dylan Calewarts | 4,377 | 1.3 | |
| Independent | Ejaz Virk (write-in) | 11 | 0.0 | |
| Total votes | 328,542 | 100.0 | ||
| Democratic hold | ||||
2018
| Party | Candidate | Votes | % | |
|---|---|---|---|---|
| Democratic | Debbie Dingell (incumbent) | 200,588 | 68.1 | |
| Republican | Jeff Jones | 85,115 | 28.9 | |
| Working Class | Gary Walkowicz | 6,712 | 2.3 | |
| Independent | Niles Niemuth | 2,213 | 0.7 | |
| Total votes | 294,628 | 100.0 | ||
| Democratic hold | ||||
2020
| Party | Candidate | Votes | % | |
|---|---|---|---|---|
| Democratic | Debbie Dingell (incumbent) | 254,957 | 66.4 | |
| Republican | Jeff Jones | 117,719 | 30.7 | |
| Working Class | Gary Walkowicz | 11,147 | 2.9 | |
| Total votes | 383,823 | 100.0 | ||
| Democratic hold | ||||
Historical district boundaries
.PNG.webp)
1993 - 2003 
2003 - 2013
See also
- Michigan's congressional districts
- List of United States congressional districts
- Martis, Kenneth C. (1989). The Historical Atlas of Political Parties in the United States Congress. New York: Macmillan Publishing Company.
- Martis, Kenneth C. (1982). The Historical Atlas of United States Congressional Districts. New York: Macmillan Publishing Company.
References
- "My Congressional District".
- "Partisan Voting Index – Districts of the 115th Congress" (PDF). The Cook Political Report. April 7, 2017. Retrieved April 7, 2017.
- 12th District Congressional Page
- U.S. Representatives 1837-2003, Michigan Manual 2003-2004
- | Census Data
- Congressional Biographical Directory of the United States 1774–present Archived 2010-04-23 at the Wayback Machine
- | U.S. REPRESENTATIVES, 1837-2003