Microlife
A microlife is a unit of risk representing half an hour change of life expectancy.[1]
Discussed by David Spiegelhalter and Alejandro Leiva, and also used by Lin et al.[2] for decision analysis, microlives are intended as a simple way of communicating the impact of a lifestyle or environmental risk factor, based on the associated daily proportional effect on expected length of life. Similar to the micromort (one in a million probability of death) the microlife is intended for "rough but fair comparisons between the sizes of chronic risks".[1] This is to avoid the biasing effects of describing risks in relative hazard ratios, converting them into somewhat tangible units. Similarly they bring long-term future risks into the here-and-now as a gain or loss of time.
- "A daily loss or gain of 30 minutes can be termed a microlife, because 1 000 000 half hours (57 years) roughly corresponds to a lifetime of adult exposure."[1]
The microlife exploits the fact that for small hazard ratios the change in life expectancy is roughly linear.[3] They are by necessity rough estimates, based on averages over population and lifetime. Effects of individual variability, short-term or changing habits, and causal factors are not taken into account.
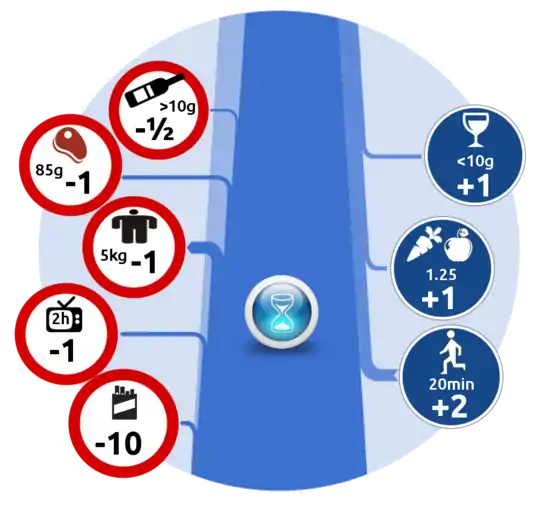
Microlives gained/lost per day of exposure, based on estimated life expectancy effects of long term lifestyle and demographic risk factors, for men and women aged 35 years.[1] Risk factor Men Women Smoking Smoking 15–24 cigarettes −10 −9 Alcohol intake First drink (of 10 g alcohol) 1 1 Each subsequent drink (up to 6) −½ −1 Obesity Per 5 units above body mass index of 22.5 each day −3 −3 Per 5 kg above optimum weight for average height each day −1 −1 Sedentary behaviour 2 hours watching television −1 −1 Diet Red meat, 1 portion (85 g, 3 oz) −1 −1 Fruit and vegetable intake, =5 servings (blood vitamin C >50 nmol/L) 4 3 Coffee intake 2-3 cups 1 1 Physical activity First 20 minutes of moderate exercise 2 2 Subsequent 40 minutes of moderate exercise 1 ½ Statins Taking a statin 1 1 Air pollution Per day living in Mexico City v London −½ −½ Geography Per day being a resident of Russia v Sweden −21 −9 Era Per day living in 2010 v 1910 15 15 Per day living in 2010 v 1980 8 5
See also
References
- Spiegelhalter, D. (2012-12-14). "Using speed of ageing and "microlives" to communicate the effects of lifetime habits and environment" (PDF). BMJ. 345 (dec14 14): e8223–e8223. doi:10.1136/bmj.e8223. ISSN 1756-1833.
- Lin, Chia-Yu, Gelman, Andrew, Price, Phillip N., and Krantz, David H. (1999). "Analysis of Local Decisions Using Hierarchical Modeling, Applied to Home Radon Measurement and Remediation" (PDF). Statistical Science. 14: 305–337.CS1 maint: multiple names: authors list (link)
- Haybittle, J. (1998-10-01). "The use of the Gompertz function to relate changes in life expectancy to the standardized mortality ratio". International Journal of Epidemiology. Oxford University Press (OUP). 27 (5): 885–889. doi:10.1093/ije/27.5.885. ISSN 1464-3685.
Further reading
- Spiegelhalter, David (2012-02-09). "Microlives: A lesson in risk taking". BBC. Retrieved 2018-12-25.CS1 maint: ref=harv (link)
- "Microlives". Understanding Uncertainty. Retrieved 2018-12-25.
- "BMJ Microlives". BMJ Microlives. Archived from the original on 2016-10-07. A calculator for about eight different factors' effect upon microlives.
