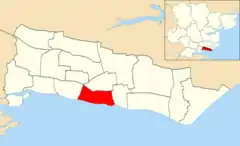
Milton Ward
Milton is an electoral ward of Southend-on-Sea covering the seafront area west of Southend town centre. It is represented by three local government councillors, each elected to serve a four-year term.
| Milton | |
|---|---|
 Milton Ward Within Southend-On-Sea | |
| Population | 11,291 [1] |
| Unitary authority | |
| Shire county | |
| Region | |
| Country | England |
| Sovereign state | United Kingdom |
| UK Parliament | |
| Councillors |
|
Boundaries
The wards boundaries are the seafront in the south, the Queensway ring road in the east and London road in the north.
Ward Profile
The ward is defined by the seafront and urban areas it covers, the area covers parts of Westcliff and southend town centre. While covering a large part of the less active part of Southend Seafront.
Councillors
These are the councillors elected for Milton ward.
| May 2002 | Ann Robertson (Con) | Jonathan Garston (Con) | Raymond Davy (Con) | |||
| May 2003 | Ann Robertson (Con) | Jonathan Garston (Con) | Raymond Davy (Con) | |||
| May 2004 | Ann Robertson (Con) | Jonathan Garston (Con) | Raymond Davy (Con) | |||
| May 2006 | Ann Robertson (Con) | Jonathan Garston (Con) | Raymond Davy (Con) | |||
| May 2007 | Ann Robertson (Con) | Jonathan Garston (Con) | Raymond Davy (Con) | |||
| May 2008 | Ann Robertson (Con) | Jonathan Garston (Con) | Nigel Folkard (Con) | |||
| May 2010 | Maria Caunce (Con) | Jonathan Garston (Con) | Nigel Folkard (Con) | |||
| May 2011 | Maria Caunce (Con) | Jonathan Garston (Con) | Nigel Folkard (Con) | |||
| May 2012 | Maria Caunce (Con) | Jonathan Garston (Con) | Julian Ware-Lane (Lab) | |||
| May 2014 | Cheryl Nevin (Lab) | Jonathan Garston (Con) | Julian Ware-Lane (Lab) | |||
| May 2015 | Cheryl Nevin (Lab) | Jonathan Garston (Con) | Julian Ware-Lane (Lab) | |||
| May 2016 | Cheryl Nevin (Lab) | Jonathan Garston (Con) | Julian Ware-Lane (Lab) | |||
| May 2018 | Cheryl Nevin (Lab) | Jonathan Garston (Con) | Julian Ware-Lane (Lab) | |||
| March 2019 | Cheryl Nevin (Lab) | Jonathan Garston (Con) | Stephen George (Lab) | |||
| May 2019 | Cheryl Nevin (Lab) | Kay Mitchell (Lab) | Stephen George (Lab) |
Indicates Councillor elected that year. Indicates Councillor defected to the Conservatives.
Elections
Elections in the 2010s
| Party | Candidate | Votes | % | ±% | |
|---|---|---|---|---|---|
| Labour | Kay Mitchell | 1,101 | 49.1 | ||
| Conservative | Jonathan Garston | 634 | 28.3 | ||
| Green | Vida Guildford | 285 | 12.7 | ||
| Liberal Democrats | Carol White | 223 | 9.9 | ||
| Majority | 467 | 20.8 | |||
| Turnout | 2,243 | 27.7 | |||
| Labour gain from Conservative | Swing | ||||
Green party candidate compared to 2018 election. No For Britain (-5.3) as previous.
| Party | Candidate | Votes | % | ±% | |
|---|---|---|---|---|---|
| Labour | Stephen George | 833 | 49.9 | ||
| Conservative | Garry Lowen | 528 | 31.6 | ||
| Liberal Democrats | Carol White | 219 | 13.1 | ||
| For Britain | James Quail | 89 | 5.3 | New | |
| Majority | 305 | 18.3 | |||
| Turnout | 1,669 | 20.6 | |||
| Labour hold | Swing | ||||
References
| Party | Candidate | Votes | % | ±% | |
|---|---|---|---|---|---|
| Labour | Cheryl Nevin | 1,305 | 50.7 | ||
| Conservative | Garry Lowen | 832 | 32.2 | ||
| Independent | Stephen Cummins | 177 | 6.9 | ||
| Green | Vida Guilford | 146 | 5.7 | ||
| Liberal Democrats | Bob Howes | 116 | 4.5 | ||
| Majority | 473 | 18.4 | — | ||
| Turnout | 2,576 | 31.5 | — | ||
| Labour hold | Swing | ||||
This article is issued from Wikipedia. The text is licensed under Creative Commons - Attribution - Sharealike. Additional terms may apply for the media files.