Pennsylvania House of Representatives, District 181
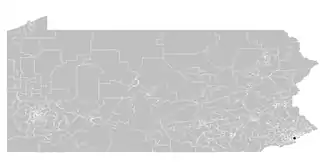
The 181st Pennsylvania House of Representatives District is located in Philadelphia and is represented by Malcolm Kenyatta.
 | |||
| [[Pennsylvania House|]] |
| ||
|---|---|---|---|
| Demographics | 25.5% White 61.8% Black 13.4% Hispanic | ||
| Population (2011) • Citizens of voting age | 60,446 47,395 | ||
District profile
The 181st Pennsylvania House of Representatives District is located in Philadelphia County. It also includes the following areas:[1]
- Ward 05 [PART, Divisions 15, 20 and 23]
- Ward 14
- Ward 16 [PART, Divisions 06, 07, 08, 09, 10, 11, 12, 13, 14, 15, 16, 17 and 18]
- Ward 18 [PART, Divisions 01, 03, 08, 09, 13, 14, 15 and 16]
- Ward 20
- Ward 32 [PART, Divisions 05, 06, 07, 08, 09, 11 and 12]
- Ward 37 [PART, Divisions 01, 02, 03, 04, 05, 06, 07, 08, 09, 10, 11, 12, 13, 14, 17 and 21]
- Ward 47
Representatives
| Representative | Party | Years | District home | Note |
|---|---|---|---|---|
| Prior to 1969, seats were apportioned by county. | ||||
| Ulysses Shelton | Democratic | 1969 – 1978 | Resigned May 23, 1978.[2] | |
| T. Milton Street | Democratic | 1979 – 1980 | ||
| Alphonso Deal | Democratic | 1981 – 1987 | Died June 3, 1987.[3] | |
| Shirley Kitchen | Democratic | 1987 – 1988 | ||
| W. Curtis Thomas | Democratic | 1989 – 2018 | Retired | |
| Malcolm Kenyatta | Democratic | 2019 – Present | ||
Recent election results
| Party | Candidate | Votes | % | ±% | |
|---|---|---|---|---|---|
| Democratic | Curtis Thomas | 14,555 | 100.0 | ||
| Margin of victory | |||||
| Turnout | 14,555 | 100.0 | |||
| Party | Candidate | Votes | % | ±% | |
|---|---|---|---|---|---|
| Democratic | Curtis Thomas | 25,275 | 100.0 | ||
| Margin of victory | |||||
| Turnout | 25,275 | 100.0 | |||
| Party | Candidate | Votes | % | ±% | |
|---|---|---|---|---|---|
| Democratic | Curtis Thomas | 12,988 | 100.0 | ||
| Margin of victory | |||||
| Turnout | 12,988 | 100.0 | |||
| Party | Candidate | Votes | % | ±% | |
|---|---|---|---|---|---|
| Democratic | Curtis Thomas | 27,603 | 100.0 | ||
| Margin of victory | |||||
| Turnout | 27,603 | 100 | |||
| Party | Candidate | Votes | % | ±% | |
|---|---|---|---|---|---|
| Democratic | Malcolm Kenyatta | 20,843 | 95.29 | ||
| Republican | T. Milton Street | 1,019 | 4.66 | ||
| Margin of victory | |||||
| Turnout | 21,884 | 95.29 | |||
References
- Cox, Harold (2004). "Legislatures - 1776-2004". Wilkes University Election Statistics Project. Wilkes University.
- "Composite Listing of House of Representatives Districts" (PDF). Pennsylvania Department of State. Retrieved 2015-02-19.
- Cox, Harold (November 3, 2004). "Pennsylvania House of Representatives - 1977-1978" (PDF). Wilkes University Election Statistics Project. Wilkes University.
- Cox, Harold (November 3, 2004). "Pennsylvania House of Representatives - 1987-1988" (PDF). Wilkes University Election Statistics Project. Wilkes University.
External links
- District map from the United States Census Bureau
- Pennsylvania House Legislative District Maps from the Pennsylvania Redistricting Commission.
- Population Data for District 181 from the Pennsylvania Redistricting Commission.
| Topics |
|  |
|---|---|---|
| Elections | ||
| Districts |
| |
This article is issued from Wikipedia. The text is licensed under Creative Commons - Attribution - Sharealike. Additional terms may apply for the media files.