Pirani gauge
The Pirani gauge is a robust thermal conductivity gauge used for the measurement of the pressures in vacuum systems.[1] It was invented in 1906 by Marcello Pirani.[2]

Marcello Stefano Pirani was a German physicist working for Siemens & Halske which was involved in the vacuum lamp industry. In 1905 their product was tantalum lamps which required a high vacuum environment for the filaments. The gauges that Pirani was using in the production environment were some fifty McLeod gauges, each filled with 2 kg of mercury in glass tubes.[3]
Pirani was aware of the gas thermal conductivity investigations of Kundt and Warburg[4] (1875) published thirty years earlier and the work of Marian Smoluchowski[5] (1898). In 1906 he described his "directly indicating vacuum gauge" that used a heated wire to measure vacuum by monitoring the heat transfer from the wire by the vacuum environment.[2]
Structure
The Pirani gauge consists of a metal sensor wire (usually gold plated tungsten or platinum) suspended in a tube which is connected to the system whose vacuum is to be measured. The wire is usually coiled to make the gauge more compact. The connection is usually made either by a ground glass joint or a flanged metal connector, sealed with an o-ring. The sensor wire is connected to an electrical circuit from which, after calibration, a pressure reading may be taken.
Mode of operation


In order to understand the technology, consider that in a gas filled system there are four ways that a heated wire transfers heat to its surroundings.
- Gas conduction at high pressure (r representing the distance from the heated wire)
- Gas transport at low pressure
- Thermal radiation
- End losses through the support structures
A heated metal wire (sensor wire, or simply sensor) suspended in a gas will lose heat to the gas as its molecules collide with the wire and remove heat. If the gas pressure is reduced the number of molecules present will fall proportionately and the wire will lose heat more slowly. Measuring the heat loss is an indirect indication of pressure.
There are three possible schemes that can be done.[2]
- Keep the bridge voltage constant and measure the change in resistance as a function of pressure
- Keep the current constant and measure the change in resistance as a function of pressure
- Keep the temperature of the sensor wire constant and measure the voltage as a function of pressure
Note that keeping the temperature constant implies that the end losses(4.) and the thermal radiation loses (3.) are constant.[3]
The electrical resistance of a wire varies with its temperature, so the resistance indicates the temperature of wire. In many systems, the wire is maintained at a constant resistance R by controlling the voltage I through the wire. The resistance can be set using a bridge circuit. The voltage required to achieve this balance is therefore a measure of the vacuum.
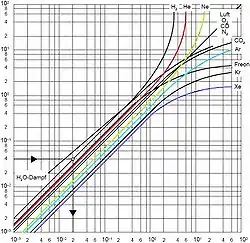
The gauge may be used for pressures between 0.5 Torr to 1×10⁻⁴ Torr. Below 5×10⁻⁴ Torr, a Pirani gauge has only one significant digit of resolution. The thermal conductivity and heat capacity of the gas affects the readout from the meter, and therefore the apparatus may need calibrating before accurate readings are obtainable. For lower pressure measurement, the thermal conductivity of the gas becomes increasingly smaller and more difficult to measure accurately, and other instruments such as a Penning gauge or Bayard–Alpert gauge are used instead.
Pulsed Pirani gauge
A special form of the Pirani gauge is the pulsed Pirani vacuum gauge where the sensor wire is not operated at a constant temperature, but is cyclically heated up to a certain temperature threshold by an increasing voltage ramp. When the threshold is reached, the heating voltage is switched off and the sensor cools down again. The required heat-up time is used as a measure of pressure.
For adequately low pressure the following relation for supplied heating power and sensor temperature T(t) applies:[6]
where is the heating capacity of the sensor wire, is the mass of the sensor wire and and are constants.
Advantages and disadvantages of the pulsed gauge
- Advantages
- Significantly better resolution in the range above 75 Torr.[7]
- The power consumption is drastically reduced compared to continuously operated Pirani gauges.
- The gauge's thermal influence on the real measurement is lowered considerably due to the low temperature threshold of 80 °C and the ramp heating in pulsed mode.
- The pulsed mode can be efficiently implemented using modern microprocessors.
- Disadvantages
- Increased calibration effort
- Longer heat-up phase
Alternative
An alternative to the Pirani gauge is the thermocouple gauge, which works on the same principle of detecting thermal conductivity of the gas by a change in temperature. In the thermocouple gauge, the temperature is sensed by a thermocouple rather than by the change in resistance of the heated wire.
References
- Ellett, A. (1931). "The Pirani Gauge for the Measurement of Small Changes of Pressure". Physical Review. 37 (9): 1102–1111. doi:10.1103/PhysRev.37.1102.
- von Pirani, M (1906). "Selbstzeigendes Vakuum-Meßinstrument". Deutsche Physikalische Gesellschaft, Verh. 24 (8): 686–694.
- Borichevsky (2017). Understanding Modern Vacuum Technology. p. 62. ISBN 9781974554461.
- Kundt, A.; Warburg, E. (1875). "Ueber Reibung und Wärmeleitung verdünnter Gase". Annalen der Physik und Chemie. 232 (10): 177–211. Bibcode:1875AnP...232..177K. doi:10.1002/andp.18752321002.
- Smoluchowski, Marian (1898). "Temperatursprung in verdünnten Gasen". Ann Phys Chem. 64: 101.
- DE 10115715, Plöchinger, Heinz, "Sensor and Method for Detecting Measurement Variables and Physical Parameters", published 2001-03-30, issued 2002-10-17, also description
- Jitschin, W.; Ludwig, S. (2004). "Gepulstes Heißdraht-Vakuummeter mit Pirani-Sensor". Vakuum in Forschung und Praxis (in German). 16: 23–29. doi:10.1002/vipr.200400015.
External links
- http://homepages.thm.de/~hg8831/vakuumlabor/litera.htm
- Jitschin, W. (2006), "100 Jahre Pirani-Vakuummeter", Vakuum in Forschung und Praxis (in German), 18 (6): 22–23, doi:10.1002/vipr.200690070
- Jitschin, W.; Ludwig, S. (2004), "Gepulstes Pirani-Vakuummeter: Berechnung von Aufheizung und Abkühlung", Vakuum in Forschung und Praxis (in German), 16: 297–301, doi:10.1002/vipr.200400235
