Politics of Liguria
The Politics of Liguria, Italy takes place in a framework of a presidential representative democracy, whereby the President of Regional Government is the head of government, and of a pluriform multi-party system. Executive power is exercised by the Regional Government. Legislative power is vested in both the government and the Regional Council.
 |
|---|
| This article is part of a series on the politics and government of Liguria |
|
Executive branch
The Regional Government (Giunta Regionale) is presided by the President of the Region (Presidente della Regione), who is elected for a five-year term, and is composed by the President and the Ministers (Assessori), who are currently 11, including a Vice President.[1]
Legislative branch
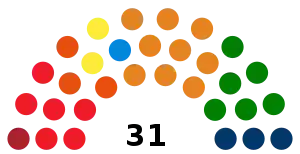
The Regional Council of Liguria (Consiglio Regionale della Liguria) is composed of 40 members. 32 councillors are elected in provincial constituencies by proportional representation using the largest remainder method with a Droop quota and open lists, while 8 councillors (elected in bloc) come from a "regional list", including the President-elect. One seat is reserved for the candidate who comes second. If a coalition wins more than 50% of the total seats in the Council with PR, only 4 candidates from the regional list will be chosen and the number of those elected in provincial constituencies will be 36. If the winning coalition receives less than 40% of votes special seats are added to the Council to ensure a large majority for the President's coalition.[2]
The Council is elected for a five-year term, but, if the President suffers a vote of no confidence, resigns or dies, under the simul stabunt, simul cadent clause introduced in 1999 (literally they will stand together or they will fall together), also the Council is dissolved and a snap election is called.[3]
Local government
Provinces
| Province | Inhabitants[4] | President | Party | Election | |
|---|---|---|---|---|---|
| Metropolitan City of Genoa | 840,934 | Marco Bucci | Independent (centre-right) | 2017 | |
| Province of Imperia | 213,743 | Fabio Natta | Independent (centre-left) | 2015 | |
| Province of La Spezia | 219,693 | Giorgio Cozzani | Independent (centre-right) | 2017 | |
| Province of Savona | 276,261 | Pierangelo Oliveri | Independent (centre-right) | 2018 | |
Provincial capitals
| Municipality | Inhabitants[4] | Mayor | Party | Election | |
|---|---|---|---|---|---|
| Genoa | 577,587 | Marco Bucci | Independent (centre-right) | 2017 | |
| Imperia | 42,506 | Claudio Scajola | Independent (centre-right) | 2018 | |
| La Spezia | 93,259 | Pierluigi Peracchini | Independent (centre-right) | 2017 | |
| Savona | 60,469 | Ilaria Caprioglio | Independent (centre-right) | 2016 | |
Parties and elections
Latest regional election
The latest regional election took place on 20–21 September 2020.
Giovanni Toti of Cambiamo!, a minor centre-right party, won handily re-election with 56.1% of the vote. His strongest challenger, Ferruccio Sansa, an independent supported by the centre-left coalition and the Five Star Movement, won 38.9%. Cambiamo! won 22.6%, followed by the Democratic Party (19.9%) and League–Liguria (17.1%).
 | ||||||||||
| Candidates | Votes | % | Seats | Parties | Votes | % | Seats | |||
|---|---|---|---|---|---|---|---|---|---|---|
| Giovanni Toti | 383,053 | 56.13 | 1 | Let's Change with Toti for President | 141,552 | 22.60 | 8 | |||
| League Salvini Liguria | 107,371 | 17.14 | 6 | |||||||
| Brothers of Italy | 68,062 | 10.87 | 3 | |||||||
| Forza Italia – Popular Liguria | 33,040 | 5.27 | 1 | |||||||
| Union of the Centre | 4,086 | 0.65 | – | |||||||
| Total | 354,111 | 56.53 | 18 | |||||||
| Ferruccio Sansa | 265,506 | 38.90 | 1 | Democratic Party – Article One | 124,586 | 19.89 | 6 | |||
| Five Star Movement | 48,722 | 7.78 | 2 | |||||||
| Ferruccio Sansa for President | 44,700 | 7.14 | 2 | |||||||
| Shared Line – Left for Sansa | 15,451 | 2.47 | 1 | |||||||
| Green Europe – Solidary Democracy – Democratic Centre | 9,193 | 1.47 | – | |||||||
| Total | 242,652 | 38.74 | 11 | |||||||
| Aristide Massardo | 16,546 | 2.42 | – | Massardo for President – PSI – +Eu – IV | 15,081 | 2.41 | – | |||
| Salvatore Alice | 6,088 | 0.89 | – | The Common Sense | 5,315 | 0.85 | – | |||
| Giacomo Chiappori | 3,569 | 0.52 | – | Great Liguria – Chiappori for President | 3,063 | 0.49 | – | |||
| Riccardo Benetti | 3,165 | 0.46 | – | Now – Respect for all Animals | 2,665 | 0.43 | – | |||
| Gaetano Russo | 1,614 | 0.24 | – | The People of Family | 1,361 | 0.22 | – | |||
| Marika Cassimatis | 1,244 | 0.18 | – | Constitutional Base – Marika Cassimatis | 911 | 0.15 | – | |||
| Davide Visigalli | 1,129 | 0.17 | – | Reconquer Italy | 905 | 0.14 | – | |||
| Caro Carpi | 576 | 0.08 | – | Carlo Carpi List – GRAF | 361 | 0.06 | – | |||
| Blank and invalid votes | 33,665 | 4.70 | ||||||||
| Total candidates | 682,490 | 100.00 | 2 | Total parties | 626,425 | 100.00 | 29 | |||
| Registered voters/turnout | 1,360,604 | 53.42 | ||||||||
| Source: Ministry of the Interior – Results | ||||||||||